NVIDIA 2006 Annual Report Download - page 82
Download and view the complete annual report
Please find page 82 of the 2006 NVIDIA annual report below. You can navigate through the pages in the report by either clicking on the pages listed below, or by using the keyword search tool below to find specific information within the annual report.-
 1
1 -
2
-
3
-
4
-
5
-
6
-
7
-
8
-
9
-
10
-
11
-
12
-
13
-
14
-
15
-
16
-
17
-
18
-
19
-
20
-
21
-
22
-
23
-
24
-
25
-
26
-
27
-
28
-
29
-
30
-
31
-
32
-
33
-
34
-
35
-
36
-
37
-
38
-
39
-
40
-
41
-
42
-
43
-
44
-
45
-
46
-
47
-
48
-
49
-
50
-
51
-
52
-
53
-
54
-
55
-
56
-
57
-
58
-
59
-
60
-
61
-
62
-
63
-
64
-
65
-
66
-
67
-
68
-
69
-
70
-
71
-
 72
72 -
 73
73 -
 74
74 -
 75
75 -
 76
76 -
 77
77 -
 78
78 -
 79
79 -
 80
80 -
 81
81 -
 82
82 -
 83
83 -
 84
84 -
 85
85 -
 86
86 -
 87
87 -
 88
88 -
 89
89 -
 90
90 -
 91
91 -
 92
92 -
93
-
94
-
95
-
96
-
97
-
98
-
99
-
100
-
101
-
102
-
103
-
104
-
105
-
106
-
107
-
108
-
109
-
110
-
111
-
112
-
113
-
114
-
115
-
116
-
117
-
118
-
119
-
120
-
121
-
122
-
123
-
124
-
125
-
126
-
127
-
128
-
129
-
130
-
131
-
132
-
133
-
134
-
135
-
136
 |
 |
NVIDIA CORPORATION AND SUBSIDIARIES
NOTES TO CONSOLIDATED FINANCIAL STATEMENTS − (Continued)
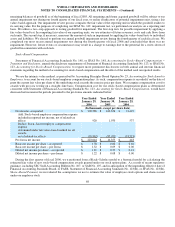
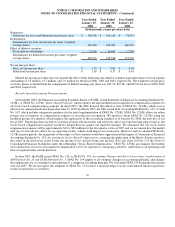
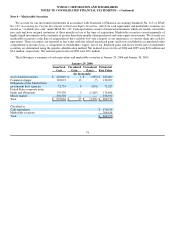
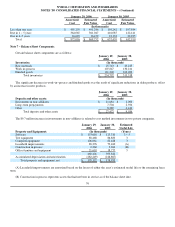
Note 6 − Marketable Securities
We account for our investment instruments in accordance with Statement of Financial Accounting Standards No. 115, or SFAS
No. 115, Accounting for Certain Investments in Debt and Equity Securities. All of our cash equivalents and marketable securities are
treated as “available−for−sale” under SFAS No. 115. Cash equivalents consist of financial instruments which are readily convertible
into cash and have original maturities of three months or less at the time of acquisition. Marketable securities consist primarily of
highly liquid investments with a maturity of greater than three months when purchased and some equity investments. We classify our
marketable securities at the date of acquisition in the available−for−sale category as our intention is to convert them into cash for
operations. These securities are reported at fair value with the related unrealized gains and losses included in accumulated other
comprehensive income (loss), a component of stockholders' equity, net of tax. Realized gains and losses on the sale of marketable
securities are determined using the specific−identification method. Net realized losses for fiscal 2006 and 2005 were $2.8 million and
$0.4 million, respectively. Net realized gains for fiscal 2004 were $2.9 million.
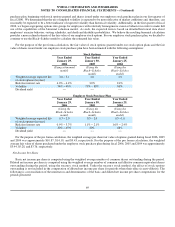
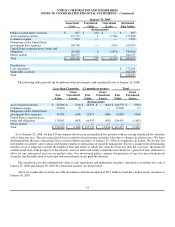
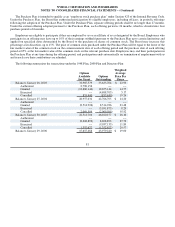
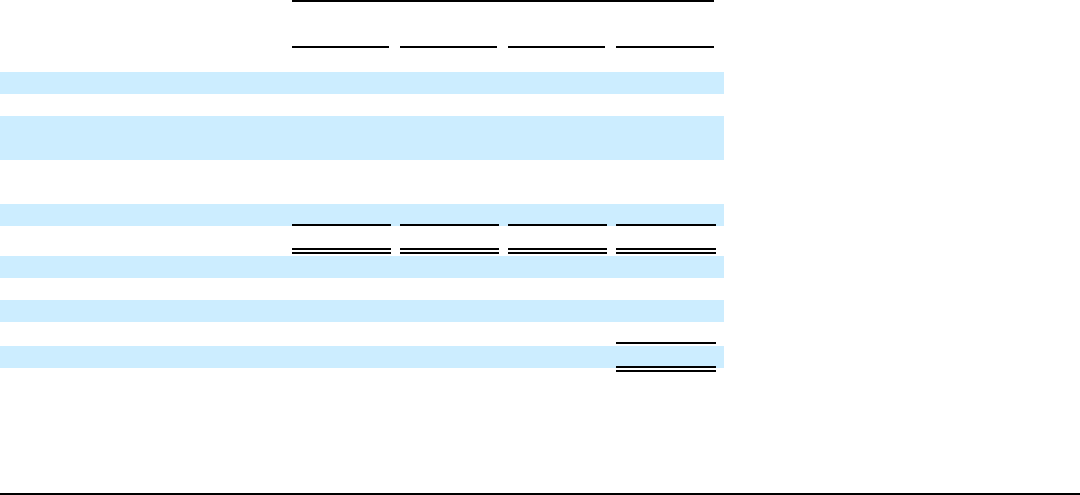
The following is a summary of cash equivalents and marketable securities at January 29, 2006 and January 30, 2005:
January 29, 2006
Amortized
Cost Unrealized
Gain Unrealized
(Loss) Estimated
Fair Value
(In thousands)
Asset−backed securities $ 224,649 $ 1 $ (983) $ 223,667
Commercial paper 138,091 13 (7) 138,097
Obligations of the United States
government & its agencies 72,753 8 (834) 71,927
United States corporate notes,
bonds and obligations 179,930 5 (1,467) 178,468
Money market 256,593 −− −− 256,593
Total $ 872,016 $ 27 $ (3,291) $ 868,752
Classified as:
Cash equivalents $ 470,334
Marketable securities 398,418
Total $ 868,752
74