Logitech 2013 Annual Report Download - page 192
Download and view the complete annual report
Please find page 192 of the 2013 Logitech annual report below. You can navigate through the pages in the report by either clicking on the pages listed below, or by using the keyword search tool below to find specific information within the annual report.-
 1
1 -
2
-
3
-
4
-
5
-
6
-
7
-
8
-
9
-
10
-
11
-
12
-
13
-
14
-
15
-
16
-
17
-
18
-
19
-
20
-
21
-
22
-
23
-
24
-
25
-
26
-
27
-
28
-
29
-
30
-
31
-
32
-
33
-
34
-
35
-
36
-
37
-
38
-
39
-
40
-
41
-
42
-
43
-
44
-
45
-
46
-
47
-
48
-
49
-
50
-
51
-
52
-
53
-
54
-
55
-
56
-
57
-
58
-
59
-
60
-
61
-
62
-
63
-
64
-
65
-
66
-
67
-
68
-
69
-
70
-
71
-
72
-
73
-
74
-
75
-
76
-
77
-
78
-
79
-
80
-
81
-
82
-
83
-
84
-
85
-
86
-
87
-
88
-
89
-
90
-
91
-
92
-
93
-
94
-
95
-
96
-
97
-
98
-
99
-
100
-
101
-
102
-
103
-
104
-
105
-
106
-
107
-
108
-
109
-
110
-
111
-
112
-
113
-
114
-
115
-
116
-
117
-
118
-
119
-
120
-
121
-
122
-
123
-
124
-
125
-
126
-
127
-
128
-
129
-
130
-
131
-
132
-
133
-
134
-
135
-
136
-
137
-
138
-
139
-
140
-
141
-
142
-
143
-
144
-
145
-
146
-
147
-
148
-
149
-
150
-
151
-
152
-
153
-
154
-
155
-
156
-
157
-
158
-
159
-
160
-
161
-
162
-
163
-
164
-
165
-
166
-
167
-
168
-
169
-
170
-
171
-
172
-
173
-
174
-
175
-
176
-
177
-
178
-
179
-
180
-
181
-
 182
182 -
 183
183 -
 184
184 -
 185
185 -
 186
186 -
 187
187 -
 188
188 -
 189
189 -
 190
190 -
 191
191 -
 192
192 -
 193
193 -
 194
194 -
 195
195 -
 196
196 -
 197
197 -
 198
198 -
 199
199 -
 200
200 -
 201
201 -
 202
202 -
203
-
204
-
205
-
206
-
207
-
208
-
209
-
210
-
211
-
212
-
213
-
214
-
215
-
216
-
217
-
218
-
219
-
220
-
221
-
222
-
223
-
224
 |
 |

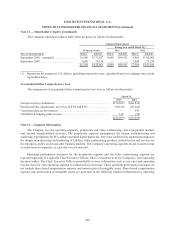
LOGITECH INTERNATIONAL S.A.
NOTES TO CONSOLIDATED FINANCIAL STATEMENTS (Continued)
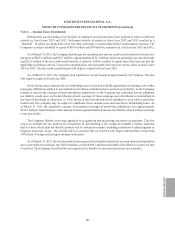
The auction rate securities are classified as non-current available-for-sale securities. These securities are
collateralized by residential and commercial mortgages, and are second-priority senior secured floating rate notes
with maturity dates in excess of 10 years. Interest rates on these notes were intended to reset through an auction
every 28 days, however auctions for these securities have failed since August 2007. During the fiscal year ended
March 31, 2012, the Company sold two of the auction rate securities with a total carrying value of $0.5 million and a
total par value of $10.0 million for $6.6 million. The gain of $6.1 million was recognized in other income (expense),
net. During the three months ended March 31, 2012, two securities with a total carrying value of $0.4 million and
a total par value of $22.2 million were liquidated. The Company did not receive any proceeds from the liquidation.
The loss of $0.4 million was recorded in accumulated other comprehensive loss, offsetting a previously recorded
temporary increase in fair value. During the fiscal year ended March 31, 2013, the Company sold its remaining two
auction rate securities with a total carrying value of $0.4 million and a total par value of $15.2 million for $0.9 million.
This sale resulted in $0.8 million of gain recognized in other income (expense), net, $0.3 million of which resulted
from the recognition of a temporary increase in fair value previously recorded in accumulated other comprehensive
loss. The par value and original cost of the auction rate securities held as of March 31, 2012 was $15.2 million. These
securities were recorded at an estimated fair value of $0.4 million at March 31, 2012. The estimated fair value was
determined by estimating future cash flows through time according to each security’s terms, including periodic
consideration of overcollateralization and interest coverage tests, and incorporating estimates of default rate, loss
severity, prepayment, and delinquency assumptions when available, for the underlying assets in the securities
based on representative indices and various research reports. The estimated coupon and principal payments were
discounted at the rate of return required by investors, based on the characteristics of each security as calculated
from the indices. Such valuation methods fall within Level 3 of the fair value hierarchy.
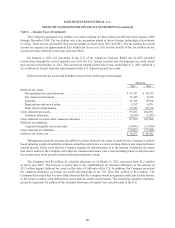
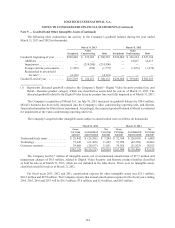
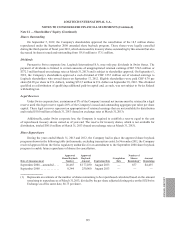
Derivative Financial Instruments
The following table presents the fair values of the Company’s derivative instruments and their locations on its
consolidated balance sheets as of March 31, 2013 and 2012 (in thousands):
Asset Derivatives Liability Derivatives
Fair Value Fair Value
March 31, March 31,
Location 2013 2012 Location 2013 2012
Derivatives designated as hedging
instruments:
Cash flow hedges ........................ Other assets $1,165 $250 Other liabilities $ — $ —
1,165 250 — —
Derivatives not designated as hedging
instruments:
Foreign exchange forward contracts ......... Other assets — 341 Other liabilities 270 148
Foreign exchange swap contracts ........... Other assets 32 67 Other liabilities 437 97
32 408 707 245
$1,197 $658 $707 $245
Note 8 — Financial Instruments (Continued)
190