Logitech 2013 Annual Report Download - page 100
Download and view the complete annual report
Please find page 100 of the 2013 Logitech annual report below. You can navigate through the pages in the report by either clicking on the pages listed below, or by using the keyword search tool below to find specific information within the annual report.-
 1
1 -
2
-
3
-
4
-
5
-
6
-
7
-
8
-
9
-
10
-
11
-
12
-
13
-
14
-
15
-
16
-
17
-
18
-
19
-
20
-
21
-
22
-
23
-
24
-
25
-
26
-
27
-
28
-
29
-
30
-
31
-
32
-
33
-
34
-
35
-
36
-
37
-
38
-
39
-
40
-
41
-
42
-
43
-
44
-
45
-
46
-
47
-
48
-
49
-
50
-
51
-
52
-
53
-
54
-
55
-
56
-
57
-
58
-
59
-
60
-
61
-
62
-
63
-
64
-
65
-
66
-
67
-
68
-
69
-
70
-
71
-
72
-
73
-
74
-
75
-
76
-
77
-
78
-
79
-
80
-
81
-
82
-
83
-
84
-
85
-
86
-
87
-
88
-
89
-
 90
90 -
 91
91 -
 92
92 -
 93
93 -
 94
94 -
 95
95 -
 96
96 -
 97
97 -
 98
98 -
 99
99 -
 100
100 -
 101
101 -
 102
102 -
 103
103 -
 104
104 -
 105
105 -
 106
106 -
 107
107 -
 108
108 -
 109
109 -
 110
110 -
111
-
112
-
113
-
114
-
115
-
116
-
117
-
118
-
119
-
120
-
121
-
122
-
123
-
124
-
125
-
126
-
127
-
128
-
129
-
130
-
131
-
132
-
133
-
134
-
135
-
136
-
137
-
138
-
139
-
140
-
141
-
142
-
143
-
144
-
145
-
146
-
147
-
148
-
149
-
150
-
151
-
152
-
153
-
154
-
155
-
156
-
157
-
158
-
159
-
160
-
161
-
162
-
163
-
164
-
165
-
166
-
167
-
168
-
169
-
170
-
171
-
172
-
173
-
174
-
175
-
176
-
177
-
178
-
179
-
180
-
181
-
182
-
183
-
184
-
185
-
186
-
187
-
188
-
189
-
190
-
191
-
192
-
193
-
194
-
195
-
196
-
197
-
198
-
199
-
200
-
201
-
202
-
203
-
204
-
205
-
206
-
207
-
208
-
209
-
210
-
211
-
212
-
213
-
214
-
215
-
216
-
217
-
218
-
219
-
220
-
221
-
222
-
223
-
224
 |
 |
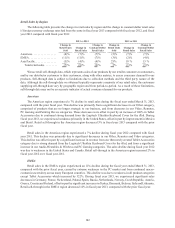
Goodwill
We perform our annual goodwill impairment test of each reporting unit as of December 31 and complete the
assessment during our fiscal fourth quarter, or more frequently, if certain events or circumstances warrant. Events
or changes in circumstances which might indicate potential impairment in goodwill include the company-specific
factors, including, but not limited to, stock price volatility, market capitalization relative to net book value, and
projected revenue, market growth and operating results. Determining the number of reporting units and the fair value
of a reporting unit requires us to make judgments and involves the use of significant estimates and assumptions. We
have two reporting units: peripherals and video conferencing. The allocation of assets and liabilities to each of our
reporting units also involves judgment and assumptions.
The goodwill impairment assessment involves three tests, Step 0, Step 1 and Step 2. The Step 0 test involves
performing an initial qualitative assessment to determine whether it is more likely than not that the asset is impaired
and thus whether it is necessary to proceed to Step 1 and calculate the fair value of the respective reporting unit. We
may proceed directly to the Step 1 test without performing the Step 0 test. The Step 1 test involves measuring the
recoverability of goodwill at the reporting unit level by comparing the reporting unit’s carrying amount, including
goodwill, to the estimated fair value of the reporting unit. The fair value is estimated using an income approach
employing a discounted cash flow (‘‘DCF’’) and a market-based model. The DCF model is based on projected cash
flows from our most recent forecast (‘‘assessment forecast’’) developed in connection with each of our reporting units
to perform the goodwill impairment assessment. The assessment forecast is based on a number of key assumptions,
including, but not limited to, discount rate, compound annual growth rate (‘‘CAGR’’) during the forecast period,
and terminal value. The terminal value is based on an exit price at the end of the assessment forecast using an
earnings multiple applied to the final year of the assessment forecast. The discount rate is applied to the projected
cash flows to reflect the risks inherent in the timing and amount of the projected cash flows, including the terminal
value, and is derived from the weighted average cost of capital of market participants in similar businesses. The
market approach model was based on applying certain revenue and earnings multiples of comparable companies
relevant to each of our reporting units to the respective revenue and earnings metrics of our reporting units. To test
the reasonableness of the fair values indicated by the income approach and the market-based approach, we also
assessed the implied premium of the aggregate fair value over the market capitalization considered attributable
to an acquisition control premium, which is the price in excess of a stock market’s price that investors would
typically pay to gain control of an entity. The discounted cash flow model and the market approach require the
exercise of significant judgment, including assumptions about appropriate discount rates, long-term growth rates
for purposes of determining a terminal value at the end of the discrete forecast period, economic expectations,
timing of expected future cash flows, and expectations of returns on equity that will be achieved. Such assumptions
are subject to change as a result of changing economic and competitive conditions. If the carrying amount of the
reporting unit exceeds its fair value as determined by these assessments, goodwill is considered impaired, and the
Step 2 test is performed to measure the amount of impairment loss. The Step 2 test measures the impairment loss
by allocating the reporting unit’s fair value to its assets and liabilities other than goodwill, comparing the resulting
implied fair value of goodwill with its carrying amount, and recording an impairment charge for the difference.
We performed our annual goodwill impairment analysis of each of our reporting units as of December 31, 2012
using the income approach and market approach described above. We chose not to perform the Step 0 test and to
proceed directly to the Step 1 test. This assessment resulted in us determining that our peripherals reporting unit
passed the Step 1 test because the estimated fair value exceeded its carrying value by more than 75%. By contrast,
our video conferencing reporting unit failed the Step 1 test because the estimated fair value was less than its
carrying value, thus requiring a Step 2 assessment of this reporting unit. This impairment primarily resulted from
a decrease in our expected CAGR during the assessment forecast period based on greater evidence of the overall
enterprise video conferencing industry experiencing a slowdown in recent quarters, combined with lower demand
related to new product launches, increased competition in fiscal year 2013 and other market data. These factors had
an adverse effect on our recent video conferencing operating results and are anticipated to have an adverse effect
on its future business.
98