Logitech 2013 Annual Report Download - page 115
Download and view the complete annual report
Please find page 115 of the 2013 Logitech annual report below. You can navigate through the pages in the report by either clicking on the pages listed below, or by using the keyword search tool below to find specific information within the annual report.-
 1
1 -
2
-
3
-
4
-
5
-
6
-
7
-
8
-
9
-
10
-
11
-
12
-
13
-
14
-
15
-
16
-
17
-
18
-
19
-
20
-
21
-
22
-
23
-
24
-
25
-
26
-
27
-
28
-
29
-
30
-
31
-
32
-
33
-
34
-
35
-
36
-
37
-
38
-
39
-
40
-
41
-
42
-
43
-
44
-
45
-
46
-
47
-
48
-
49
-
50
-
51
-
52
-
53
-
54
-
55
-
56
-
57
-
58
-
59
-
60
-
61
-
62
-
63
-
64
-
65
-
66
-
67
-
68
-
69
-
70
-
71
-
72
-
73
-
74
-
75
-
76
-
77
-
78
-
79
-
80
-
81
-
82
-
83
-
84
-
85
-
86
-
87
-
88
-
89
-
90
-
91
-
92
-
93
-
94
-
95
-
96
-
97
-
98
-
99
-
100
-
101
-
102
-
103
-
104
-
 105
105 -
 106
106 -
 107
107 -
 108
108 -
 109
109 -
 110
110 -
 111
111 -
 112
112 -
 113
113 -
 114
114 -
 115
115 -
 116
116 -
 117
117 -
 118
118 -
 119
119 -
 120
120 -
 121
121 -
 122
122 -
 123
123 -
 124
124 -
 125
125 -
126
-
127
-
128
-
129
-
130
-
131
-
132
-
133
-
134
-
135
-
136
-
137
-
138
-
139
-
140
-
141
-
142
-
143
-
144
-
145
-
146
-
147
-
148
-
149
-
150
-
151
-
152
-
153
-
154
-
155
-
156
-
157
-
158
-
159
-
160
-
161
-
162
-
163
-
164
-
165
-
166
-
167
-
168
-
169
-
170
-
171
-
172
-
173
-
174
-
175
-
176
-
177
-
178
-
179
-
180
-
181
-
182
-
183
-
184
-
185
-
186
-
187
-
188
-
189
-
190
-
191
-
192
-
193
-
194
-
195
-
196
-
197
-
198
-
199
-
200
-
201
-
202
-
203
-
204
-
205
-
206
-
207
-
208
-
209
-
210
-
211
-
212
-
213
-
214
-
215
-
216
-
217
-
218
-
219
-
220
-
221
-
222
-
223
-
224
 |
 |

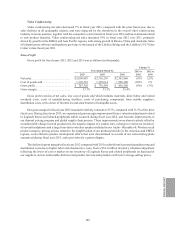
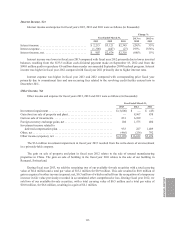
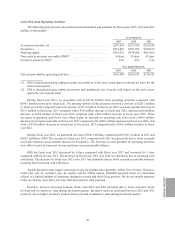
Interest Income, Net
Interest income and expense for fiscal years 2013, 2012 and 2011 were as follows (in thousands):
Year Ended March 31,
Change %
2013 vs
2012
2012 vs
20112013 2012 2011
Interest income . . . . . . . . . . . . . . . . . . . . . . . . . . . . . . . . $ 2,215 $3,121 $2,343 (29)% 33%
Interest expense . . . . . . . . . . . . . . . . . . . . . . . . . . . . . . . . (1,308) (447) (27) 193% 1556%
Interest income, net . . . . . . . . . . . . . . . . . . . . . . . . . . . . . $ 907 $2,674 $2,316 (66)% 15%
Interest income was lower in fiscal year 2013 compared with fiscal year 2012 primarily due to lower invested
balances resulting from the $133.5 million cash dividend payment made on September 18, 2012 and from the
$90.0 million paid to repurchase 8.6 million shares under our amended September 2008 buyback program. Interest
income was higher in fiscal year 2012 compared with fiscal year 2011 primarily due to higher interest rates.
Interest expense was higher in fiscal year 2013 and 2012 compared with corresponding prior fiscal year
primarily due to commitment fees and non-recurring fees related to the revolving credit facility entered into in
December 2011.
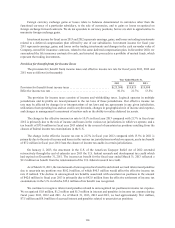
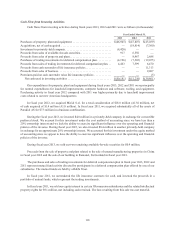
Other Income, Net
Other income and expense for fiscal years 2013, 2012 and 2011 were as follows (in thousands):
Year Ended March 31,
2013 2012 2011
Investment impairment . . . . . . . . . . . . . . . . . . . . . . . . . . . . . . . . . . . . . . . . . . . . $ (3,600) $ — $ (43)
Gain (loss) on sale of property and plant. . . . . . . . . . . . . . . . . . . . . . . . . . . . . . . — 8,967 838
Gain on sale of investments. . . . . . . . . . . . . . . . . . . . . . . . . . . . . . . . . . . . . . . . . 831 6,109 —
Foreign currency exchange gains, net . . . . . . . . . . . . . . . . . . . . . . . . . . . . . . . . . 104 1,575 480
Investment income related to
deferred compensation plan. . . . . . . . . . . . . . . . . . . . . . . . . . . . . . . . . . . . . . 933 227 1,409
Other, net . . . . . . . . . . . . . . . . . . . . . . . . . . . . . . . . . . . . . . . . . . . . . . . . . . . . . . . (466) (256) 792
Other income (expense), net . . . . . . . . . . . . . . . . . . . . . . . . . . . . . . . . . . . . . . . . $ (2,198) $16,622 $3,476
The $3.6 million investment impairment in fiscal year 2013 resulted from the write-down of an investment
in a privately-held company.
The gain on sale of property and plant in fiscal year 2012 relates to the sale of unused manufacturing
properties in China. The gain on sale of building in the fiscal year 2011 relates to the sale of our building in
Romanel, Switzerland.
During fiscal year 2013, we sold the remaining two of our available-for-sale securities with a total carrying
value of $0.4 million and a total par value of $15.2 million for $0.9 million. This sale resulted in $0.8 million of
gain recognized in other income (expense), net, $0.3 million of which resulted from the recognition of a temporary
increase in fair value previously recorded in accumulated other comprehensive loss. During fiscal year 2012, we
sold two of our available-for-sale securities, with a total carrying value of $0.5 million and a total par value of
$10.0 million, for $6.6 million, resulting in a gain of $6.1 million.
ANNUAL REPORT
113