Logitech 2013 Annual Report Download - page 135
Download and view the complete annual report
Please find page 135 of the 2013 Logitech annual report below. You can navigate through the pages in the report by either clicking on the pages listed below, or by using the keyword search tool below to find specific information within the annual report.-
 1
1 -
2
-
3
-
4
-
5
-
6
-
7
-
8
-
9
-
10
-
11
-
12
-
13
-
14
-
15
-
16
-
17
-
18
-
19
-
20
-
21
-
22
-
23
-
24
-
25
-
26
-
27
-
28
-
29
-
30
-
31
-
32
-
33
-
34
-
35
-
36
-
37
-
38
-
39
-
40
-
41
-
42
-
43
-
44
-
45
-
46
-
47
-
48
-
49
-
50
-
51
-
52
-
53
-
54
-
55
-
56
-
57
-
58
-
59
-
60
-
61
-
62
-
63
-
64
-
65
-
66
-
67
-
68
-
69
-
70
-
71
-
72
-
73
-
74
-
75
-
76
-
77
-
78
-
79
-
80
-
81
-
82
-
83
-
84
-
85
-
86
-
87
-
88
-
89
-
90
-
91
-
92
-
93
-
94
-
95
-
96
-
97
-
98
-
99
-
100
-
101
-
102
-
103
-
104
-
105
-
106
-
107
-
108
-
109
-
110
-
111
-
112
-
113
-
114
-
115
-
116
-
117
-
118
-
119
-
120
-
121
-
122
-
123
-
124
-
 125
125 -
 126
126 -
 127
127 -
 128
128 -
 129
129 -
 130
130 -
 131
131 -
 132
132 -
 133
133 -
 134
134 -
 135
135 -
 136
136 -
 137
137 -
 138
138 -
 139
139 -
 140
140 -
 141
141 -
 142
142 -
 143
143 -
 144
144 -
 145
145 -
146
-
147
-
148
-
149
-
150
-
151
-
152
-
153
-
154
-
155
-
156
-
157
-
158
-
159
-
160
-
161
-
162
-
163
-
164
-
165
-
166
-
167
-
168
-
169
-
170
-
171
-
172
-
173
-
174
-
175
-
176
-
177
-
178
-
179
-
180
-
181
-
182
-
183
-
184
-
185
-
186
-
187
-
188
-
189
-
190
-
191
-
192
-
193
-
194
-
195
-
196
-
197
-
198
-
199
-
200
-
201
-
202
-
203
-
204
-
205
-
206
-
207
-
208
-
209
-
210
-
211
-
212
-
213
-
214
-
215
-
216
-
217
-
218
-
219
-
220
-
221
-
222
-
223
-
224
 |
 |

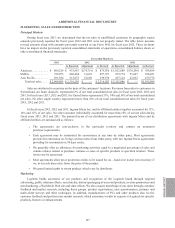
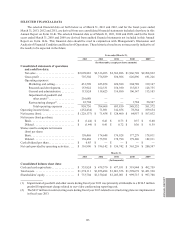
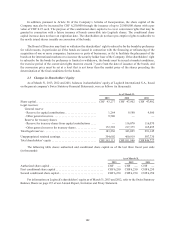
SELECTED FINANCIAL DATA
The selected financial data set forth below as of March 31, 2013 and 2012, and for the fiscal years ended
March 31, 2013, 2012 and 2011, are derived from our consolidated financial statements included elsewhere in this
Annual Report on Form 10-K. The selected financial data as of March 31, 2011, 2010 and 2009, and for the fiscal
years ended March 31, 2010 and 2009 are derived from audited financial statements not included in this Annual
Report on Form 10-K. This financial data should be read in conjunction with Management’s Discussion and
Analysis of Financial Condition and Results of Operations. These historical results are not necessarily indicative of
the results to be expected in the future.
Year ended March 31,
2013 2012 2011 2010 2009
(In thousands, except per share amounts)
Consolidated statements of operations
and cash flow data:
Net sales . . . . . . . . . . . . . . . . . . . . . . . . . . . $2,099,883 $2,316,203 $2,362,886 $1,966,748 $2,208,832
Gross profit . . . . . . . . . . . . . . . . . . . . . . . . 707,302 776,589 836,506 626,896 691,226
Operating expenses:
Marketing and selling. . . . . . . . . . . . . . 431,598 423,854 420,580 304,788 319,167
Research and development . . . . . . . . . . 153,922 162,331 156,390 135,813 128,755
General and administrative . . . . . . . . . 113,824 118,423 116,880 106,147 113,103
Impairment of goodwill and
other assets(1) . . . . . . . . . . . . . . . . . . 216,688 — — — —
Restructuring charges(2) . . . . . . . . . . . . 43,704 — — 1,784 20,547
Total operating expenses . . . . . . . . 959,736 704,608 693,850 548,532 581,572
Operating income (loss). . . . . . . . . . . . . . . . . . (252,434) 71,981 142,656 78,364 109,654
Net income (loss) . . . . . . . . . . . . . . . . . . . . . . . $ (228,137) $ 71,458 $ 128,460 $ 64,957 $ 107,032
Net income (loss) per share:
Basic . . . . . . . . . . . . . . . . . . . . . . . . . . . . . . $ (1.44) $ 0.41 $ 0.73 $ 0.37 $ 0.60
Diluted . . . . . . . . . . . . . . . . . . . . . . . . . . . . $ (1.44) $ 0.41 $ 0.72 $ 0.36 $ 0.59
Shares used to compute net income
(loss) per share:
Basic . . . . . . . . . . . . . . . . . . . . . . . . . . . . . . 158,468 174,648 176,928 177,279 178,811
Diluted . . . . . . . . . . . . . . . . . . . . . . . . . . . . 158,468 175,591 178,790 179,340 182,911
Cash dividend per share. . . . . . . . . . . . . . . . . . $ 0.85 $ — $ — $ — $ —
Net cash provided by operating activities . . . . $ 116,990 $ 196,142 $ 156,742 $ 365,259 $ 200,587
March 31,
2013 2012 2011 2010 2009
(In thousands)
Consolidated balance sheet data:
Cash and cash equivalents . . . . . . . . . . . . . . . . $ 333,824 $ 478,370 $ 477,931 $ 319,944 $ 492,759
Total assets. . . . . . . . . . . . . . . . . . . . . . . . . . . . $1,374,111 $1,856,494 $ 1,861,556 $1,599,678 $1,421,530
Shareholders’ equity . . . . . . . . . . . . . . . . . . . . $ 733,704 $1,150,241 $1,205,001 $ 999,715 $ 997,708
(1) Impairment of goodwill and other assets during fiscal year 2013 was primarily attributable to a $214.5 million
goodwill impairment charge related to our video conferencing reporting unit.
(2) The $43.7 million in restructuring costs during fiscal year 2013 related to restructuring plans we implemented
in fiscal year 2013.
ANNUAL REPORT
133