Logitech 2013 Annual Report Download - page 179
Download and view the complete annual report
Please find page 179 of the 2013 Logitech annual report below. You can navigate through the pages in the report by either clicking on the pages listed below, or by using the keyword search tool below to find specific information within the annual report.-
 1
1 -
2
-
3
-
4
-
5
-
6
-
7
-
8
-
9
-
10
-
11
-
12
-
13
-
14
-
15
-
16
-
17
-
18
-
19
-
20
-
21
-
22
-
23
-
24
-
25
-
26
-
27
-
28
-
29
-
30
-
31
-
32
-
33
-
34
-
35
-
36
-
37
-
38
-
39
-
40
-
41
-
42
-
43
-
44
-
45
-
46
-
47
-
48
-
49
-
50
-
51
-
52
-
53
-
54
-
55
-
56
-
57
-
58
-
59
-
60
-
61
-
62
-
63
-
64
-
65
-
66
-
67
-
68
-
69
-
70
-
71
-
72
-
73
-
74
-
75
-
76
-
77
-
78
-
79
-
80
-
81
-
82
-
83
-
84
-
85
-
86
-
87
-
88
-
89
-
90
-
91
-
92
-
93
-
94
-
95
-
96
-
97
-
98
-
99
-
100
-
101
-
102
-
103
-
104
-
105
-
106
-
107
-
108
-
109
-
110
-
111
-
112
-
113
-
114
-
115
-
116
-
117
-
118
-
119
-
120
-
121
-
122
-
123
-
124
-
125
-
126
-
127
-
128
-
129
-
130
-
131
-
132
-
133
-
134
-
135
-
136
-
137
-
138
-
139
-
140
-
141
-
142
-
143
-
144
-
145
-
146
-
147
-
148
-
149
-
150
-
151
-
152
-
153
-
154
-
155
-
156
-
157
-
158
-
159
-
160
-
161
-
162
-
163
-
164
-
165
-
166
-
167
-
168
-
 169
169 -
 170
170 -
 171
171 -
 172
172 -
 173
173 -
 174
174 -
 175
175 -
 176
176 -
 177
177 -
 178
178 -
 179
179 -
 180
180 -
 181
181 -
 182
182 -
 183
183 -
 184
184 -
 185
185 -
 186
186 -
 187
187 -
 188
188 -
 189
189 -
190
-
191
-
192
-
193
-
194
-
195
-
196
-
197
-
198
-
199
-
200
-
201
-
202
-
203
-
204
-
205
-
206
-
207
-
208
-
209
-
210
-
211
-
212
-
213
-
214
-
215
-
216
-
217
-
218
-
219
-
220
-
221
-
222
-
223
-
224
 |
 |

LOGITECH INTERNATIONAL S.A.
NOTES TO CONSOLIDATED FINANCIAL STATEMENTS (Continued)
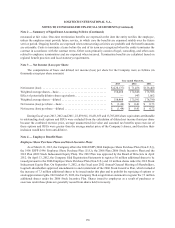
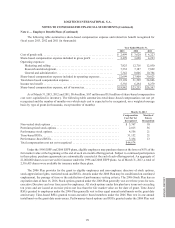
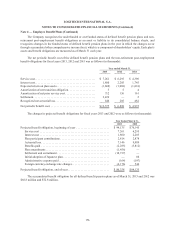
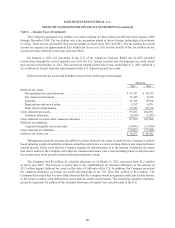
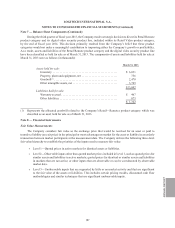
The following table presents the changes in the fair value of defined benefit pension plan assets for fiscal
years 2013 and 2012 (in thousands):
Year Ended March 31,
2013 2012
Fair value of plan assets, beginning of year . . . . . . . . . . . . . . . . . . . . . . . . . . $ 50,669 $45,937
Actual return on plan assets. . . . . . . . . . . . . . . . . . . . . . . . . . . . . . . . . . . . 2,889 219
Employer contributions . . . . . . . . . . . . . . . . . . . . . . . . . . . . . . . . . . . . . . . 5,800 5,071
Plan participant contributions . . . . . . . . . . . . . . . . . . . . . . . . . . . . . . . . . . 2,814 2,878
Benefits paid . . . . . . . . . . . . . . . . . . . . . . . . . . . . . . . . . . . . . . . . . . . . . . . (2,285) (3,812)
Settlement. . . . . . . . . . . . . . . . . . . . . . . . . . . . . . . . . . . . . . . . . . . . . . . . . . (11,093) —
Administrative expenses paid . . . . . . . . . . . . . . . . . . . . . . . . . . . . . . . . . . (164) (197)
Foreign currency exchange rate changes. . . . . . . . . . . . . . . . . . . . . . . . . . (2,628) 573
Fair value of plan assets, end of year. . . . . . . . . . . . . . . . . . . . . . . . . . . . . . . . $ 46,002 $50,669
The Company’s investment objectives are to ensure that the assets of its defined benefit plans are invested to
provide an optimal rate of investment return on the total investment portfolio, consistent with the assumption of a
reasonable risk level, and to ensure that pension funds are available to meet the plans’ benefit obligations as they
become due. The Company believes that a well-diversified investment portfolio will result in the highest attainable
investment return with an acceptable level of overall risk. Investment strategies and allocation decisions are also
governed by applicable governmental regulatory agencies. The Company’s investment strategy with respect to its
largest defined benefit plan, which is available only to Swiss employees, is to invest in the following allocation
ranges: 28 - 43% for equities, 33-63% for Swiss bonds, 5-15% for foreign bonds, 5-15% for hedge and investment
funds, and 0-20% for cash and cash equivalents. The Company’s other defined benefit plans, which comprise
approximately 3% of total defined benefit plan assets as of March 31, 2013, have similar investment and allocation
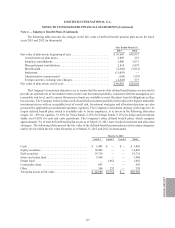
strategies. The following tables present the fair value of the defined benefit pension plan assets by major categories
and by levels within the fair value hierarchy as of March 31, 2013 and 2012 (in thousands):
March 31, 2013
Level 1 Level 2 Level 3 Tota l
Cash . . . . . . . . . . . . . . . . . . . . . . . . . . . . . . . . . . . . . . . . . $ 5,405 $ — $ — $ 5,405
Equity securities . . . . . . . . . . . . . . . . . . . . . . . . . . . . . . . . 14,802 — — 14,802
Debt securities . . . . . . . . . . . . . . . . . . . . . . . . . . . . . . . . . 19,714 — — 19,714
Swiss real estate fund . . . . . . . . . . . . . . . . . . . . . . . . . . . . 3,968 — — 3,968
Hedge fund . . . . . . . . . . . . . . . . . . . . . . . . . . . . . . . . . . . . — 1,062 — 1,062
Commodity fund. . . . . . . . . . . . . . . . . . . . . . . . . . . . . . . . 693 — — 693
Other . . . . . . . . . . . . . . . . . . . . . . . . . . . . . . . . . . . . . . . . . 106 252 — 358
Total plan assets at fair value . . . . . . . . . . . . . . . . . . . . . . $ 44,688 $1,314 $ — $46,002
Note 4 — Employee Benefit Plans (Continued)
ANNUAL REPORT
177