Logitech 2013 Annual Report Download - page 112
Download and view the complete annual report
Please find page 112 of the 2013 Logitech annual report below. You can navigate through the pages in the report by either clicking on the pages listed below, or by using the keyword search tool below to find specific information within the annual report.-
 1
1 -
2
-
3
-
4
-
5
-
6
-
7
-
8
-
9
-
10
-
11
-
12
-
13
-
14
-
15
-
16
-
17
-
18
-
19
-
20
-
21
-
22
-
23
-
24
-
25
-
26
-
27
-
28
-
29
-
30
-
31
-
32
-
33
-
34
-
35
-
36
-
37
-
38
-
39
-
40
-
41
-
42
-
43
-
44
-
45
-
46
-
47
-
48
-
49
-
50
-
51
-
52
-
53
-
54
-
55
-
56
-
57
-
58
-
59
-
60
-
61
-
62
-
63
-
64
-
65
-
66
-
67
-
68
-
69
-
70
-
71
-
72
-
73
-
74
-
75
-
76
-
77
-
78
-
79
-
80
-
81
-
82
-
83
-
84
-
85
-
86
-
87
-
88
-
89
-
90
-
91
-
92
-
93
-
94
-
95
-
96
-
97
-
98
-
99
-
100
-
101
-
 102
102 -
 103
103 -
 104
104 -
 105
105 -
 106
106 -
 107
107 -
 108
108 -
 109
109 -
 110
110 -
 111
111 -
 112
112 -
 113
113 -
 114
114 -
 115
115 -
 116
116 -
 117
117 -
 118
118 -
 119
119 -
 120
120 -
 121
121 -
 122
122 -
123
-
124
-
125
-
126
-
127
-
128
-
129
-
130
-
131
-
132
-
133
-
134
-
135
-
136
-
137
-
138
-
139
-
140
-
141
-
142
-
143
-
144
-
145
-
146
-
147
-
148
-
149
-
150
-
151
-
152
-
153
-
154
-
155
-
156
-
157
-
158
-
159
-
160
-
161
-
162
-
163
-
164
-
165
-
166
-
167
-
168
-
169
-
170
-
171
-
172
-
173
-
174
-
175
-
176
-
177
-
178
-
179
-
180
-
181
-
182
-
183
-
184
-
185
-
186
-
187
-
188
-
189
-
190
-
191
-
192
-
193
-
194
-
195
-
196
-
197
-
198
-
199
-
200
-
201
-
202
-
203
-
204
-
205
-
206
-
207
-
208
-
209
-
210
-
211
-
212
-
213
-
214
-
215
-
216
-
217
-
218
-
219
-
220
-
221
-
222
-
223
-
224
 |
 |

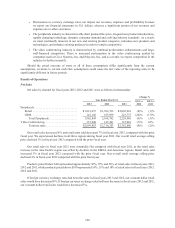
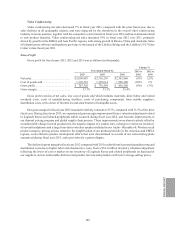
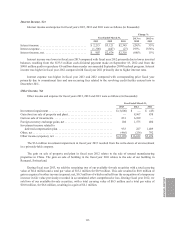
Operating Expenses
Operating expenses for fiscal years 2013, 2012 and 2011 were as follows (in thousands):
Year Ended March 31,
Change %
2013 vs
2012
2012 vs
20112013 2012 2011
Marketing and selling ..................... $431,598 $423,854 $420,580 2% 1%
% of net sales ......................... 20.6% 18.3% 17.8%
Research and development ................. 153,922 162,331 156,390 (5)% 4%
% of net sales ......................... 7.3% 7.0% 6.6%
General and administrative ................. 113,824 118,423 116,880 (4)% 1%
% of net sales ......................... 5.4% 5.1% 4.9%
Impairment of goodwill and other assets ...... 216,688 — — NM 0%
% of net sales ......................... 10.3% 0.0% 0.0%
Restructuring charges ..................... 43,704 — — NM 0%
% of net sales ......................... 2.1% 0.0% 0.0%
Total operating expenses ................... $959,736 $704,608 $693,850 36% 2%
% of net sales ......................... 45.7% 30.4% 29.4%
The increase in total operating expenses as a percentage of net sales in fiscal year 2013 compared with
fiscal year 2012 was primarily attributable to the $214.5 million goodwill impairment charge related to our video
conferencing reporting unit and from the $43.7 million in costs related to restructuring plans we implemented in
fiscal year 2013.
Our operating expenses are incurred in U.S. dollars, Chinese renminbi, Swiss francs, euros, and, to a lesser
extent, 29 other currencies. To the extent that the U.S. dollar significantly increases or decreases in value relative
to the currencies in which our operating expenses are denominated, the reported dollar amounts of our sales and
expenses may decrease or increase. We refer to our operating expenses excluding the impact of foreign currency
exchange rates as constant dollar operating expenses. Constant dollar operating expenses are a non-GAAP
financial measure, which is information derived from consolidated financial information but not presented in our
financial statements prepared in accordance with U.S. GAAP. Our management uses these non-GAAP measures
in its financial and operational decision-making, and believes these non-GAAP measures, when considered in
conjunction with the corresponding GAAP measures, facilitate a better understanding of changes in operating
expenses. Constant dollar operating expenses are calculated by translating current period operating expenses in
each local currency at the prior period’s average exchange rate for that currency.
Marketing and Selling
Marketing and selling expense consists of personnel and related overhead costs, corporate and product
marketing, promotions, advertising, trade shows, customer and technical support and facilities costs.
Marketing and selling expense increased 2% in fiscal year 2013 compared with the same period of the prior
fiscal year. We experienced increased advertising, product design, consulting and marketing expenses associated
with the launch of new products, which were partially offset by decreases in personnel-related expenses and
share-based compensation expense from restructuring plans we implemented in fiscal year 2013.
Marketing and selling expense increased 1% in fiscal year 2012 compared with 2011, primarily from
higher personnel-related expenses resulting from increased headcount for LifeSize, the enterprise market team,
and the Asia Pacific region, higher infrastructure costs to support the additional headcount, and the settlement
of a customer bankruptcy dispute. These increases were substantially offset by a decrease in variable demand
generation activities compared with fiscal year 2011, and a decrease in accrued bonus expense resulting from lower
than anticipated profitability levels.
110