JVC 2011 Annual Report Download - page 3
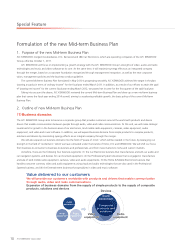
Download and view the complete annual report
Please find page 3 of the 2011 JVC annual report below. You can navigate through the pages in the report by either clicking on the pages listed below, or by using the keyword search tool below to find specific information within the annual report.-
 1
1 -
 2
2 -
 3
3 -
 4
4 -
 5
5 -
 6
6 -
 7
7 -
 8
8 -
 9
9 -
 10
10 -
 11
11 -
 12
12 -
 13
13 -
 14
14 -
15
-
16
-
17
-
18
-
19
-
20
-
21
-
22
-
23
-
24
-
25
-
26
-
27
-
28
-
29
-
30
-
31
-
32
-
33
-
34
-
35
-
36
-
37
-
38
-
39
-
40
 |
 |

JVC KENWOOD Corporation 1
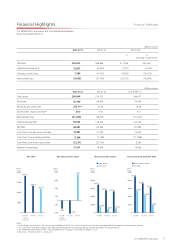
(Millions of yen)
FYE 3/11 FYE 3/ʼ10 FYE 3/ʼ09
※1※2
Including 1st half of JVC
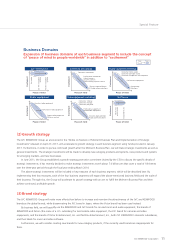
Net Sales 352,672 398,663 311,299 545,603
Operating income (loss) 12,957 (6,454) (1,537) (4,006)
Ordinary income (loss) 7,580 (14,753) (9,760) (16,525)
Net income (loss) (4,025) (27,796) (30,735) (42,890)
(Millions of yen)
FYE 3/11 FYE 3/ʼ10 FYE 3/ʼ09*1※1
Total assets 260,664 274,752 344,077
Net assets 52,740 46,819 74,439
Net assets per share (Yen) 375.19※347.45 75.08
Stockholdersʼ equity ratio (%)※420.0 16.7 21.1
Retained earnings (41,305) (38,301) (10,765)
Interest-bearing debt 93,053 108,306 134,100
Net debt 28,081 64,804 81,683
Cash flows from operating activities 19,987 21,453 10,425
Cash flows from investing activities 5,354 (3,158) (11,288)
Cash flows from financing activities (2,291) (27,120) 9,265
Number of employees 17,271 18,446 19,540
FYE 3/’09
including
1st half of JVC
FYE 3/’10
0
0
10,000
14,000
6,000
2,000
-2,000
-6,000
FYE 3/’11FYE 3/’09
including
1st half of JVC
FYE 3/’10
500,000
400,000
300,000
200,000
100,000
FYE 3/’09 FYE 3/’10
0
150,000
120,000
90,000
60,000
30,000
FYE 3/’09 FYE 3/’10
0
Net sales Operating income (loss) Total assets/Net assets Interest-bearing debt/Net debt
ota at
Nt at
ntrtarin t
Nt t
12
30
22
3
1
FYE 3/’11
20
20
13100
1030
FYE 3/’11
303
201
00
FYE 3/’11
(
Millions
)
of yen
(
Millions
)
of yen
(
Millions
)
of yen
(
Millions
)
of yen
600,000
450,000
300,000
150,000
03
2
33
322
13
0
Notes:
1. In the Groupʼs earnings results for the fiscal year ended March 2009, JVCʼs results for the first half are not consolidated due to the adoption of the purchase method.
2. JVCʼs net sales in the reference figures have been converted under the net method and have not been certified by the accounting firm.
3. JVC KENWOOD conducted a 10-for-1 stock consolidation of its common shares effective August 1, 2011.
4. (Net assets – Minority interests) ÷ Total assets
Financial Highlights
JVC KENWOOD Corporation and Consolidated Subsidiaries
Fiscal Year ended March 31
Financial Highlights