JVC 2011 Annual Report Download - page 14
Download and view the complete annual report
Please find page 14 of the 2011 JVC annual report below. You can navigate through the pages in the report by either clicking on the pages listed below, or by using the keyword search tool below to find specific information within the annual report.-
 1
1 -
2
-
3
-
 4
4 -
 5
5 -
 6
6 -
 7
7 -
 8
8 -
 9
9 -
 10
10 -
 11
11 -
 12
12 -
 13
13 -
 14
14 -
 15
15 -
 16
16 -
 17
17 -
 18
18 -
 19
19 -
 20
20 -
 21
21 -
 22
22 -
 23
23 -
 24
24 -
25
-
26
-
27
-
28
-
29
-
30
-
31
-
32
-
33
-
34
-
35
-
36
-
37
-
38
-
39
-
40
 |
 |

JVC KENWOOD Corporation
12
Brand Strategy
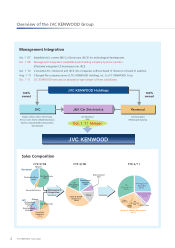
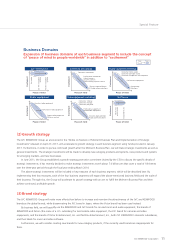
The JVC KENWOOD Group on May 28, 2010 formulated the current three-year Mid-term Business Plan that runs from the fiscal year
ended March 2011 through the fiscal year ending March 2013. It then mapped out specific measures for the plan on October 28, 2010.
In the fiscal year ended in March 2011, the initial year of the current Mid-term Business Plan, profits expanded well above
projections due to the benefits of structural reform and strong performance of the core businesses. Given this, and also factoring in the
effects of strategic investments that were newly decided, the Group revised the numerical goals of the plan on April 28, 2011.
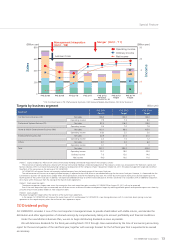
Despite the yenʼs further appreciation and other negative factors that are weighing on sales, the performance of the four business
segments continues to be steady, with all of them posting an operating profit in the first quarter of the current fiscal year. Also, favorable
results are expected from strategic investments. Against this backdrop, we set management targets of the new Mid-term Business Plan
for the fiscal year ending March 2014, as shown below.
Mid-term targets (consolidated) (Assumed exchange rate: 1USD = 80 JPY, 1EUR = 110 JPY)
・Net sales: 430.0 billion yen; operating income: 20.0 billion yen; ordinary income: 14.0 billion yen; net income: 11.0 billion yen
・Shareholdersʼ equity ratio: 26%; net D/E ratio: 0.5 times or less
・Net income per share: 79 yen; net assets per share: 490 yen
(Reference) Earnings trends (consolidated) (Billions yen)
FYE 3/11
(For reference)
FYE 3/12
Forecast
(announced on Oct. 28)
FYE 3/13 FYE 3/14
Target
Initial target Revised target
Net sales 352.7 333.0 410.0 390.0 430.0
Operating income 13.0 14.0 17.0 18.0 20.0
Ordinary income 7.6 10.0 12.0 13.0 14.0
Net income (loss) (4.0) 6.5 9.0 10.0 11.0
* Forecast figures for the fiscal year ending March 2012 are those announced on April 27, 2011, and will be revised as necessary through close examination by the
time of announcing the accounting report for the second quarter of the said fiscal year.
(4)
Management targets
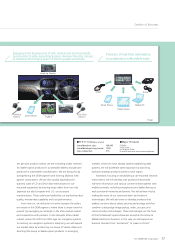
Special Feature
New genre of products
New Brand