JVC 2002 Annual Report Download - page 45
Download and view the complete annual report
Please find page 45 of the 2002 JVC annual report below. You can navigate through the pages in the report by either clicking on the pages listed below, or by using the keyword search tool below to find specific information within the annual report.-
 1
1 -
2
-
3
-
4
-
5
-
6
-
7
-
8
-
9
-
10
-
11
-
12
-
13
-
14
-
15
-
16
-
17
-
18
-
19
-
20
-
21
-
22
-
23
-
24
-
25
-
26
-
27
-
28
-
29
-
30
-
31
-
32
-
33
-
34
-
 35
35 -
 36
36 -
 37
37 -
 38
38 -
 39
39 -
 40
40 -
 41
41 -
 42
42 -
 43
43 -
 44
44 -
 45
45 -
 46
46 -
 47
47 -
 48
48 -
 49
49 -
 50
50 -
 51
51 -
 52
52
 |
 |

ANNUAL REPORT 2 0 0 2
4 3
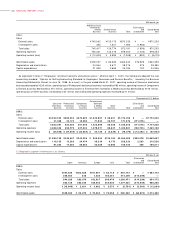
Millions of yen
Elimination
and Consolidated
Japan Americas Europe Asia Total unallocation total
2001:
Sales
External sales ¥454,626 ¥261,185 ¥151,269 ¥ 67,270 ¥ 934,350 ¥ —¥934,350
Intersegment sales 263,473 182 873 170,233 434,761 (434,761) —
Total sales 718,099 261,367 152,142 237,503 1,369,111 (434,761) 934,350
Operating expenses 716,531 258,272 150,301 236,238 1,361,342 (432,684) 928,658
Operating income ¥ 1,568 ¥ 3,095 ¥ 1,841 ¥ 1,265 ¥ 7,769 ¥ (2,077) ¥ 5,692
Identifiable assets ¥379,008 ¥ 99,105 ¥ 67,343 ¥ 75,655 ¥ 6 21,111 ¥ (34,483) ¥586,628
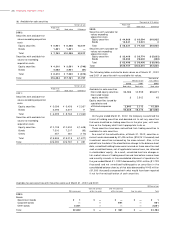
As explained in Note 2 “Employees’ retirement benefits and pension plans,” effective April 1, 2000, the Companies adopted the new
accounting standard, “Opinion on Setting Accounting Standard for Employees’ Severance and Pension Benefits,” issued by the Business
Accounting Deliberation Council on June 16, 1998. As a result, in the year ended March 31, 2001, operating income of Japan decreased by
¥555 million and unallocated operating expenses increased by ¥1 million.
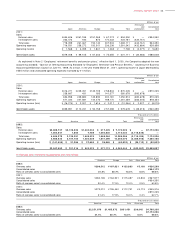
Millions of yen
Elimination
and Consolidated
Japan Americas Europe Asia Total unallocation total
2000:
Sales
External sales ¥416,271 ¥249,451 ¥145,709 ¥ 58,804 ¥ 870,235 ¥ —¥870,235
Intersegment sales 238,687 431 183 141,377 380,678 (380,678) —
Total sales 654,958 249,882 145,892 200,181 1,250,913 (380,678) 870,235
Operating expenses 671,232 247,581 144,276 198,170 1,261,259 (383,005) 878,254
Operating income (loss) ¥ (16,274) ¥ 2,301 ¥ 1,616 ¥ 2,011 ¥ (10,346) ¥ 2,327 ¥ (8,019)
Identifiable assets ¥359,991 ¥110,231 ¥ 52,158 ¥ 57,298 ¥ 579,678 ¥ (39,319) ¥540,359
Thousands of U.S. dollars
Elimination
and Consolidated
Japan Americas Europe Asia Total unallocation total
2002:
Sales
External sales $ 2 ,98 9 ,7 37 $ 2 ,1 2 6,52 6 $ 1,4 4 0 ,5 3 4 $ 6 17 ,4 2 9 $ 7 ,1 7 4,22 6 $ —$7,174,226
Intersegment sales 1,854,541 1,865 7,789 1,250,835 3,115,030 (3,115,030) —
Total sales 4 ,8 4 4 ,2 7 8 2 ,1 2 8 ,3 9 1 1 ,4 4 8 ,3 2 3 1 ,8 6 8 , 2 6 4 1 0 ,2 8 9 ,2 5 6 (3 ,1 1 5 ,0 3 0 ) 7 ,1 7 4 , 2 2 6
Operating expenses 4 ,9 8 5 ,9 3 3 2 ,1 0 7 ,1 0 5 1 ,4 2 0 ,6 3 9 1 ,8 4 1 ,3 9 9 1 0 ,3 5 5 ,0 7 6 (3 ,0 8 9 ,9 1 8 ) 7 ,2 6 5 ,1 5 8
Operating income (loss) $ (1 41 ,6 5 5) $ 2 1 ,2 8 6 $ 27 ,6 8 4 $ 2 6,8 6 5 $ (6 5 ,8 2 0 ) $ (25 ,1 1 2) $ (9 0,93 2 )
Identifiable assets $2 ,5 47 ,6 9 2 $ 7 0 1,31 6 $ 5 4 3,32 3 $ 5 7 1 ,1 13 $ 4 ,3 6 3 ,4 4 4 $ (5 0 3,5 5 7 ) $ 3 ,8 5 9 ,8 8 7
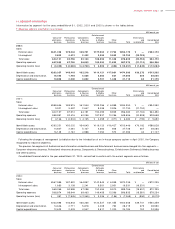
3) Overseas sales information by geographic area is as follows:
Millions of yen
Americas Europe Asia Other areas Total
2002:
Overseas sales ¥2 9 9 ,5 1 2 ¥197,621 ¥123,883 ¥5,193 ¥626,209
Consolidated sales ¥954,172
Ratio of overseas sales to consolidated sales 3 1 .4 % 2 0 .7 % 1 3 .0 % 0 . 5 % 6 5 . 6 %
2001:
Overseas sales ¥284,165 ¥163,521 ¥115,487 ¥4,804 ¥567,977
Consolidated sales ¥934,350
Ratio of overseas sales to consolidated sales 30.4% 17.5% 12.4% 0.5% 60.8%
2000:
Overseas sales ¥273,012 ¥155,440 ¥112,751 ¥4,113 ¥545,316
Consolidated sales ¥870,235
Ratio of overseas sales to consolidated sales 31.4% 17.9% 13.0% 0.4% 62.7%
Thousands of U.S. dollars
Americas Europe Asia Other area Total
2002:
Overseas sales $2,251,970 $1,485,872 $931,451 $39,045 $4,708,338
Consolidated sales $7,174,226
Ratio of overseas sales to consolidated sales 3 1 .4 % 2 0 .7 % 1 3 .0 % 0 . 5 % 6 5 .6 %