JVC 2002 Annual Report Download - page 24
Download and view the complete annual report
Please find page 24 of the 2002 JVC annual report below. You can navigate through the pages in the report by either clicking on the pages listed below, or by using the keyword search tool below to find specific information within the annual report.-
 1
1 -
2
-
3
-
4
-
5
-
6
-
7
-
8
-
9
-
10
-
11
-
12
-
13
-
 14
14 -
 15
15 -
 16
16 -
 17
17 -
 18
18 -
 19
19 -
 20
20 -
 21
21 -
 22
22 -
 23
23 -
 24
24 -
 25
25 -
 26
26 -
 27
27 -
 28
28 -
 29
29 -
 30
30 -
 31
31 -
 32
32 -
 33
33 -
 34
34 -
35
-
36
-
37
-
38
-
39
-
40
-
41
-
42
-
43
-
44
-
45
-
46
-
47
-
48
-
49
-
50
-
51
-
52
 |
 |

ANNUAL REPORT 2 0 0 22 2
0
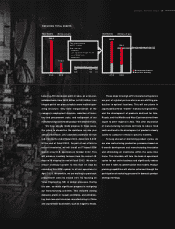
175
350
525
700
9 8 0 29 9 0 0 0 1
STOCKHOLDERS’ EQUITY/
TOTAL ASSETS
(Billions of yen)
Stockholders’ equity
Total assets
NET INCOME (LOSS)
(Billions of yen)
-5 0
-2 5
0
2 5
5 0
9 8 0 29 9 0 0 0 1
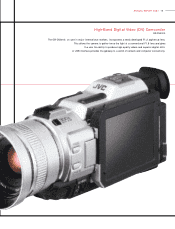
encoders and format converters from television
broadcasters. In contrast, JVC struggled with
weakening demand in the markets for professional
audio systems, karaoke systems and Direct-Drive
Image Light Amplifier (D-ILA) projectors. Overseas,
the Professional electronics segment was affected
by the deteriorating U.S. market, just as consumer
electronics were, with professional camcorders and
D-ILA projectors facing an uphill battle.
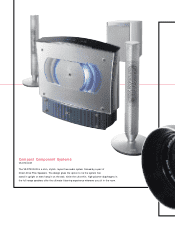
COMPONENTS & DEVICES
Components & Devices recorded a 19.2%, or ¥11.8
billion, decline in sales year on year, to ¥49.7 billion
(US$374 million), while operating income fell ¥8.9
billion to a loss of ¥4.7 billion (US$36 million). High-
density build-up multilayer printed wiring boards
(“VIL” PWBs), deflection yokes and other products
could not escape the impact of depressed mobile
phone and PC markets and falling prices. However,
there were a few bright spots—motors for hard disk
drives (HDDs) and optical disc products, and optical
pickups for car CD players.
ENTERTAINMENT SOFTWARES & MEDI AS
Sales in this segment fell 3.4%, or ¥6.3 billion, to
¥177.0 billion (US$1,331 million). Despite hit
records from artists such as Keisuke Kuwata and
Dragon Ash, sales fell due to the industry-wide
slump in softwares and medias. The segment posted
operating income of ¥3.2 billion (US$24 million),
¥1.2 billion less than in the previous fiscal year.
OTHER
Sales increased 11.4%, or ¥0.8 billion, to ¥7.9 billion
(US$59 million), while the operating loss increased
¥0.1 billion to ¥0.5 billion (US$3.6 million).
INCOM E (LOSS) BEFORE INCOME
TAXES AND M INORITY INTERESTS
Income before income taxes and minority interests
fell ¥47.9 billion year on year to a loss of ¥38.4
billion (US$289 million). This decline was primarily
due to restructuring charges and loss from write-down
of investment in securities.
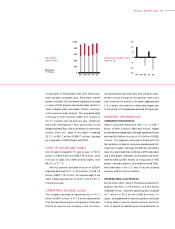
NET INCOME (LOSS)
Net income fell ¥47.1 billion to a net loss of ¥44.6
billion (US$335 million). As a result, net income per
share of ¥9.8 in the previous fiscal year became a net
loss of ¥175.3. ROE was negative 27.3%, a deterio-
ration of 28.6 percentage points.
Consequently, the company made the difficult
decision not to pay a dividend for the year.
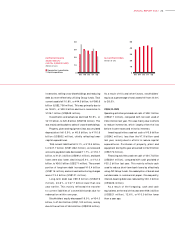
LIQUIDITY AND SOURCES OF FUNDS
ASSETS, LIABILITIES AND CAPITAL
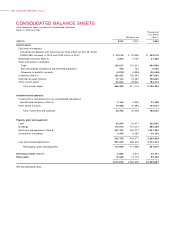
Total assets as of March 31, 2002 stood at ¥513.4
billion (US$3,860 million), a 12.5%, or ¥73.3
billion decline from one year earlier. This was the
result of efforts to reduce assets by cutting back