JVC 2002 Annual Report Download - page 29
Download and view the complete annual report
Please find page 29 of the 2002 JVC annual report below. You can navigate through the pages in the report by either clicking on the pages listed below, or by using the keyword search tool below to find specific information within the annual report.-
 1
1 -
2
-
3
-
4
-
5
-
6
-
7
-
8
-
9
-
10
-
11
-
12
-
13
-
14
-
15
-
16
-
17
-
18
-
 19
19 -
 20
20 -
 21
21 -
 22
22 -
 23
23 -
 24
24 -
 25
25 -
 26
26 -
 27
27 -
 28
28 -
 29
29 -
 30
30 -
 31
31 -
 32
32 -
 33
33 -
 34
34 -
 35
35 -
 36
36 -
 37
37 -
 38
38 -
 39
39 -
40
-
41
-
42
-
43
-
44
-
45
-
46
-
47
-
48
-
49
-
50
-
51
-
52
 |
 |

ANNUAL REPORT 2 0 0 2
2 7
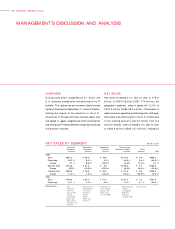
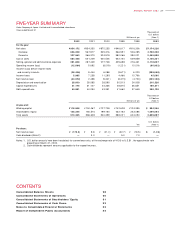
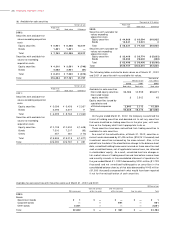
FIVE-YEAR SUM M ARY
Thousands of
U.S. dollars
Millions of yen (Note 1)
2 0 0 2 2001 2000 1999 1998 2 0 0 2
For the year:
Net sales ¥ 9 5 4 ,1 7 2 ¥934,350 ¥870,235 ¥946,617 ¥916,306 $7,174,226
Overseas 626,209 567,977 545,316 566,551 526,285 4,708,338
Domestic 327,963 366,373 324,919 380,066 390,021 2,465,888
Cost of sales 684,458 641,209 600,506 642,140 629,859 5,146,301
Selling, general and administrative expenses 281,808 287,449 277,748 305,698 276,431 2,118,857
Operating income (loss) (1 2 ,0 9 4 ) 5,692 (8,019) (1,221) 10,016 (9 0 ,9 3 2 )
Income (Loss) before income taxes
and minority interests (3 8 ,4 4 6 ) 9,444 6,088 (3,671) 6,223 (2 8 9 ,0 6 8 )
Income taxes 5 ,9 8 5 7,238 11,295 4,466 10,796 45,000
Net income (loss) (4 4 ,5 7 2 ) 2,498 (5,341) (8,315) (4,703) (3 3 5 ,1 2 8 )
Depreciation and amortization 2 8 ,0 0 0 28,085 28,590 30,513 24,008 2 1 0 ,5 2 6
Capital expenditures 2 1 ,1 7 5 31,127 24,336 28,815 36,651 1 5 9 ,2 1 1
R&D expenditures 4 0 ,9 8 1 44,094 43,351 41,660 37,649 3 0 8 ,1 2 8
Thousands of
U.S.dollars
Millions of yen (Note 1)
At year-end:
Working capital ¥ 1 1 8 ,9 4 8 ¥150,067 ¥127,709 ¥142,628 ¥124,395 $ 8 9 4,3 4 6
Stockholders’ equity 146,246 180,515 199,164 232,162 243,086 1,099,594
Total assets 513,365 586,628 540,359 588,001 624,050 3,859,887
U.S. dollars
Yen (Note 1)
Per share:
Net income (loss) ¥
(1 75 .3 ) ¥ 9.8 ¥
(21.0) ¥ (32.7) ¥ (18.5) $ (1 .3 2 )
Cash dividends (Note 2) —3.0 —5.0 7.0 —
Notes: 1. U.S. dollar amounts have been translated, for convenience only, at the exchange rate of ¥133 to U.S.$1, the approximate rate
prevailing on March 31, 2002.
2. Cash dividends represent amounts applicable to the respective years.
Victor Company of Japan, Limited and its consolidated subsidiaries
Years ended March 3 1
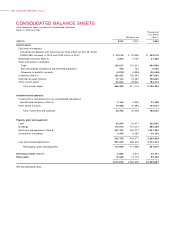
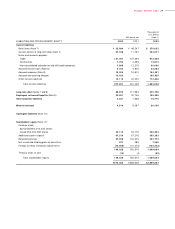
Consolidated Balance Sheets 2 8
Consolidated Statements of Operations 3 0
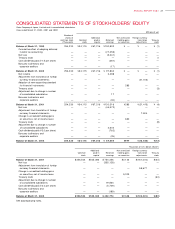
Consolidated Statements of Stockholders’ Equity 3 1
Consolidated Statements of Cash Flows 3 2
Notes to Consolidated Financial Statements 3 3
Report of Independent Public Accountants 4 4
CONTENTS