JVC 2002 Annual Report Download - page 34
Download and view the complete annual report
Please find page 34 of the 2002 JVC annual report below. You can navigate through the pages in the report by either clicking on the pages listed below, or by using the keyword search tool below to find specific information within the annual report.-
 1
1 -
2
-
3
-
4
-
5
-
6
-
7
-
8
-
9
-
10
-
11
-
12
-
13
-
14
-
15
-
16
-
17
-
18
-
19
-
20
-
21
-
22
-
23
-
 24
24 -
 25
25 -
 26
26 -
 27
27 -
 28
28 -
 29
29 -
 30
30 -
 31
31 -
 32
32 -
 33
33 -
 34
34 -
 35
35 -
 36
36 -
 37
37 -
 38
38 -
 39
39 -
 40
40 -
 41
41 -
 42
42 -
 43
43 -
 44
44 -
45
-
46
-
47
-
48
-
49
-
50
-
51
-
52
 |
 |

ANNUAL REPORT 2 0 0 23 2
Thousands of
U.S. dollars
Millions of yen (Note 1)
2 0 0 2 2001 2000 2 0 0 2
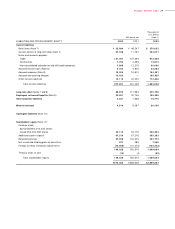
Cash flows from operating activities:
Income (Loss) before income taxes and minority interests ¥(38,446) ¥ 9,444 ¥ 6,088 $(289,068)
Depreciation and amortization 2 6 ,8 2 6 27,047 28,953 2 0 1 ,6 9 9
Interest and dividend income (1,108) (2,509) (2,408) (8 ,3 3 1 )
Interest expense 4 ,4 4 7 5,383 6,178 33,436
Unrealized loss (gain) from changes in fair market values of trading securities 280 (9,749) (16,386) 2 ,1 0 5
Increase in accrued restructuring charges 1 3 ,4 2 3 ——1 0 0 ,9 2 5
Gain on sales of investment securities (1,099) (1,450) (6,330) (8 ,2 6 3 )
Decrease (Increase) in notes and accounts receivable 1 2 ,0 5 5 (18,046) 5,069 90,639
Decrease (Increase) in inventories 3 5 ,3 7 0 (29,751) 3,667 2 6 5 ,9 4 0
Increase (Decrease) in notes and accounts payable (1 8 ,2 2 4 ) 8,737 10,634 (1 3 7 ,0 2 3 )
Other 4 ,9 2 0 1,527 (5,441) 36,994
Sub-total 3 8 ,4 4 4 (9,367) 30,024 2 8 9 ,0 5 3
Interest and dividends received 1 ,1 7 8 2,433 2,307 8 ,8 5 7
Interest paid (4,539) (5,143) (6,180) (3 4 ,1 2 8 )
Income taxes paid (7,001) (14,330) (7,389) (5 2 ,6 3 9 )
Net cash provided by (used in) operating activities 2 8 ,0 8 2 (26,407) 18,762 2 1 1 ,1 4 3
Cash flows from investing activities:
Purchases of time deposits —(8,150) ——
Sales of time deposits 3 ,0 0 0 ——22,556
Purchases of property, plant and equipment (2 2 ,8 5 3 ) (28 ,942) (23,121) (1 7 1 ,8 2 7 )
Proceeds from sales of property, plant and equipment 2 ,7 1 0 4,883 319 20,376
Purchases of marketable securities (1 3 ,0 0 6 ) (43,687) (59,983) (9 7 ,7 8 9 )
Sales of marketable securities 1 8 ,1 6 6 63,612 66,813 1 3 6 ,5 8 6
Purchases of investment securities (7 1 9 ) (3,552) (10,809) (5 ,4 0 6 )
Sales of investment securities 5 ,2 8 5 6,714 11,999 39,737
Other 1 ,7 9 9 1,255 614 13,526
Net cash used in investing activities (5 ,6 1 8 ) (7,867) (14,168) (4 2 ,2 4 1 )
Cash flows from financing activities:
Proceeds from long-term debt 1 ,2 3 0 1 3,603 9 ,2 4 8
Repayments of long-term debt (4,254) (1,577) (316) (3 1 ,9 8 5 )
Proceeds from issuance of bonds —37,372 ——
Redemption of bonds (1 0 ,1 0 1 ) —(9,040) (7 5 ,9 4 7 )
Increase (Decrease) in short-term bank loans, net (1 5 ,2 0 8 ) 6,300 (15,549) (1 1 4 ,3 4 6 )
Increase (Decrease) in commercial paper, net (5,527) (7,661) 10,884 (4 1 ,5 5 6 )
Cash dividends paid (9 7 0 ) (255) (632) (7 ,2 9 3 )
Other 121 1,025 315 909
Net cash provided by (used in) financing activities (34 ,7 0 9 ) 35,205 (10,735) (2 6 0 , 9 7 0 )
Effect of exchange rate changes on cash and cash equivalents 2 ,13 6 6,675 (4,188) 16,060
Effect of changes in number of consolidated subsidiaries
and companies accounted for based on the equity method 1 2 9 60 1,764 970
Net increase (decrease) in cash and cash equivalents (9,9 8 0 ) 7,666 (8,565) (7 5 ,0 3 8 )
Cash and cash equivalents at beginning of the year 7 9 ,2 51 71,585 80,150 5 9 5 ,8 7 3
Cash and cash equivalents at end of the year ¥ 69 ,2 7 1 ¥ 79,251 ¥ 71,585 $ 520,835
See accompanying notes.
CONSOLIDATED STATEM ENTS OF CASH FLOW S
Victor Company of Japan, Limited and its consolidated subsidiaries
Years ended March 3 1, 2002, 2001 and 20 00