JVC 2001 Annual Report Download - page 6
Download and view the complete annual report
Please find page 6 of the 2001 JVC annual report below. You can navigate through the pages in the report by either clicking on the pages listed below, or by using the keyword search tool below to find specific information within the annual report.-
 1
1 -
 2
2 -
 3
3 -
 4
4 -
 5
5 -
 6
6 -
 7
7 -
 8
8 -
 9
9 -
 10
10 -
 11
11 -
 12
12 -
 13
13 -
 14
14 -
 15
15 -
 16
16 -
 17
17 -
18
-
19
-
20
-
21
-
22
-
23
-
24
-
25
-
26
-
27
-
28
-
29
-
30
-
31
-
32
-
33
-
34
-
35
-
36
-
37
-
38
-
39
-
40
-
41
-
42
-
43
-
44
-
45
-
46
-
47
-
48
 |
 |

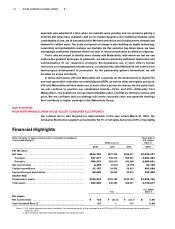
Financial Highlights
< 4VICTOR COMPANY OF JAPAN, LIMITED 5 >
Victor Company of Japan, Limited and its consolidated subsidiaries Thousands of
Years ended March 31 U.S. dollars
Millions of yen (Note 1)
2001 2000 1999 2001
For the year:
Net sales . . . . . . . . . . . . . . . . . . . . . . . . . . . . . . . . . . . . . . . . . . . . . . . . ¥934,350 ¥870,235 ¥946,617 $7,535,081
Overseas . . . . . . . . . . . . . . . . . . . . . . . . . . . . . . . . . . . . . . . . . . . . . . 567,977 545,316 566,551 4,580,460
Domestic . . . . . . . . . . . . . . . . . . . . . . . . . . . . . . . . . . . . . . . . . . . . . . 366,373 324,919 380,066 2,954,621
Net income (loss) . . . . . . . . . . . . . . . . . . . . . . . . . . . . . . . . . . . . . . . . . 2,498 (5,341) (8,315) 20,145
Capital expenditures . . . . . . . . . . . . . . . . . . . . . . . . . . . . . . . . . . . . . . . 31,127 24,336 28,815 251,024
Depreciation and amortization . . . . . . . . . . . . . . . . . . . . . . . . . . . . . . 28,085 28,590 30,513 226,492
At year-end:
Stockholders’ equity . . . . . . . . . . . . . . . . . . . . . . . . . . . . . . . . . . . . . . . ¥180,515 ¥199,164 ¥232,162 $1,455,766
Total assets . . . . . . . . . . . . . . . . . . . . . . . . . . . . . . . . . . . . . . . . . . . . . . 586,628 540,359 588,001 4,730,871
U.S. dollars
Yen (Note 1)
Per share:
Net income (loss) . . . . . . . . . . . . . . . . . . . . . . . . . . . . . . . . . . . . . . . . . ¥ 9.8 ¥(21.0) ¥(32.7) $ 0.08
Cash dividends (Note 2) . . . . . . . . . . . . . . . . . . . . . . . . . . . . . . . . . . . . 3.0 —5.0 0.02
Notes:1. U.S. dollar amounts have been translated, for convenience only, at the exchange rate of ¥124 to U.S.$1, the approximate rate prevailing on
March 31, 2001.
2. Cash dividends represent amounts applicable to respective years.
approach was adopted at a time when our markets were growing and our products gaining a
foothold. But times have changed—and so too market dynamics. Our traditional markets, while
considerable in size, are at saturation point. We have entered an era of replacement demand and
demand for added value. The scale and speed of change is also building as digital technology,
networking and globalization reshape our markets. As this evolution has taken place, we have
increasingly confronted situations where our lack of resources prevents an effective response.
That’s why we intend to identify more closely with Matsushita, with whom we feel we can
capture the greatest synergies. In particular, we want to eliminate inefficient duplication and
cannibalization of our respective products. Encompassing use of each other’s human
resources and management infrastructure, our partnership with Matsushita will extend from
technological development to production. As the partnership gathers momentum, we will
broaden its scope and depth.
In terms of products, JVC and Matsushita will cooperate on the development of digital TVs
and next-generation videodisk recorders/players (VDR), as well as other synergistic products.
JVC and Matsushita will also make use of each other’s production bases. On the sales front,
we will continue to position our established brands—Victor and JVC—differently from
Matsushita’s. Our brands are an important intangible asset, one that we intend to nurture and
grow. We are confident that our strategy will create corporate value and generate earnings
that contribute to higher earnings in the Matsushita Group.
D&N STRATEGY
HIGH PERFORMANCE, HIGH-VALUE-ADDED CONSUMER ELECTRONICS
Our product mix is also targeted for improvement. In the year ended March 31, 2001, the
Consumer Electronics segment accounted for 64.1% of net sales, but a mere 0.6% of operating