JVC 2001 Annual Report Download - page 40
Download and view the complete annual report
Please find page 40 of the 2001 JVC annual report below. You can navigate through the pages in the report by either clicking on the pages listed below, or by using the keyword search tool below to find specific information within the annual report.-
 1
1 -
2
-
3
-
4
-
5
-
6
-
7
-
8
-
9
-
10
-
11
-
12
-
13
-
14
-
15
-
16
-
17
-
18
-
19
-
20
-
21
-
22
-
23
-
24
-
25
-
26
-
27
-
28
-
29
-
 30
30 -
 31
31 -
 32
32 -
 33
33 -
 34
34 -
 35
35 -
 36
36 -
 37
37 -
 38
38 -
 39
39 -
 40
40 -
 41
41 -
 42
42 -
 43
43 -
 44
44 -
 45
45 -
 46
46 -
 47
47 -
 48
48
 |
 |

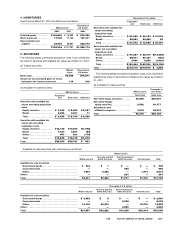
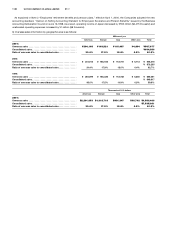
Consolidated financial data for the year ended March 31, 2000, reclassified to conform with the current segments is as follows.
Millions of yen
Entertainment
Consumer Professional Components Softwares Eliminations
electronics electronics & Devices & Medias Other and Consolidated
business business business business business Total unallocation total
2000:
Sales
External sales . . . . . . . . . . . . . . . . . ¥567,585 ¥87,891 ¥64,857 ¥142,943 ¥6,959 ¥870,235 ¥—¥870,235
Intersegment sales . . . . . . . . . . . . . 1,680 3,108 2,241 9,551 2,951 19,531 (19,531) —
Total sales . . . . . . . . . . . . . . . . . . . . 569,265 90,999 67,098 152,494 9,910 889,766 (19,531) 870,235
Operating expenses . . . . . . . . . . . . . . 568,874 98,944 69,463 149,458 10,096 896,835 (18,581) 878,254
Operating income (loss) . . . . . . . . . . . ¥391 ¥(7,945) ¥(2,365) ¥3,036 ¥(186) ¥(7,069) ¥(950) ¥(8,019)
Identifiable assets . . . . . . . . . . . . . . . . ¥263,598 ¥46,843 ¥36,235 ¥122,527 ¥31,455 ¥500,658 ¥ 39,701 ¥540,359
Depreciation & amortization . . . . . . . 14,626 2,771 5,818 4,208 792 28,215 375 28,590
Capital expenditures . . . . . . . . . . . . . . 12,623 2,303 4,547 3,511 1,200 24,184 152 24,336
Millions of yen
Audiovisual and
information- Eliminations
related Entertainment and Consolidated
business business Total unallocation total
2000:
Sales
External sales . . . . . . . . . . . . . . . . . . . . . . . . . . . . . . . . . . . . . . . . . . . . . . . . . . ¥745,062 ¥125,173 ¥870,235 ¥—¥870,235
Intersegment sales . . . . . . . . . . . . . . . . . . . . . . . . . . . . . . . . . . . . . . . . . . . . . . 355 1,601 1,956 (1,956) —
Total sales . . . . . . . . . . . . . . . . . . . . . . . . . . . . . . . . . . . . . . . . . . . . . . . . . . . . . 745,417 126,774 872,191 (1,956) 870,235
Operating expenses . . . . . . . . . . . . . . . . . . . . . . . . . . . . . . . . . . . . . . . . . . . . . . . 756,041 123,219 879,260 (1,006) 878,254
Operating income (loss) . . . . . . . . . . . . . . . . . . . . . . . . . . . . . . . . . . . . . . . . . . . . ¥ (10,624) ¥3,555 ¥(7,069) ¥(950) ¥(8,019)
Identifiable assets . . . . . . . . . . . . . . . . . . . . . . . . . . . . . . . . . . . . . . . . . . . . . . . . . ¥378,737 ¥84,693 ¥463,430 ¥ 76,929 ¥540,359
Depreciation & amortization . . . . . . . . . . . . . . . . . . . . . . . . . . . . . . . . . . . . . . . . 24,544 3,671 28,215 375 28,590
Capital expenditures . . . . . . . . . . . . . . . . . . . . . . . . . . . . . . . . . . . . . . . . . . . . . . . 21,529 2,655 24,184 152 24,336
1999:
Sales
External sales . . . . . . . . . . . . . . . . . . . . . . . . . . . . . . . . . . . . . . . . . . . . . . . . . . ¥797,682 ¥148,935 ¥946,617 ¥—¥946,617
Intersegment sales . . . . . . . . . . . . . . . . . . . . . . . . . . . . . . . . . . . . . . . . . . . . . . 55 1,330 1,385 (1,385) —
Total sales . . . . . . . . . . . . . . . . . . . . . . . . . . . . . . . . . . . . . . . . . . . . . . . . . . . . . 797,737 150,265 948,002 (1,385) 946,617
Operating expenses . . . . . . . . . . . . . . . . . . . . . . . . . . . . . . . . . . . . . . . . . . . . . . . 802,298 145,715 948,013 (175) 947,838
Operating income (loss) . . . . . . . . . . . . . . . . . . . . . . . . . . . . . . . . . . . . . . . . . . . . ¥ (4,561) ¥4,550 ¥(11) ¥(1,210) ¥(1,221)
Identifiable assets . . . . . . . . . . . . . . . . . . . . . . . . . . . . . . . . . . . . . . . . . . . . . . . . . ¥407,814 ¥76,738 ¥484,552 ¥103,449 ¥588,001
Depreciation & amortization . . . . . . . . . . . . . . . . . . . . . . . . . . . . . . . . . . . . . . . . 26,542 3,622 30,164 349 30,513
Capital expenditures . . . . . . . . . . . . . . . . . . . . . . . . . . . . . . . . . . . . . . . . . . . . . . . 25,093 3,444 28,537 278 28,815
Thousands of U.S. dollars
Entertainment
Consumer Professional Components Softwares Eliminations
electronics electronics & Devices & Medias Other and Consolidated
business business business business business Total unallocation total
2001:
Sales
External sales . . . . . . . . . . . . . . $4,827,710 $676,734 $496,323 $1,477,871 $ 56,443 $7,535,081 $ —$7,535,081
Intersegment sales . . . . . . . . . . 28,395 29,008 21,347 72,895 23,597 175,242 (175,242) —
Total sales . . . . . . . . . . . . . . . . . 4,856,105 705,742 517,670 1,550,766 80,040 7,710,323 (175,242) 7,535,081
Operating expenses . . . . . . . . . . . 4,830,573 745,290 484,323 1,514,815 83,032 7,658,033 (168,855) 7,489,178
Operating income (loss) . . . . . . . . $ 25,532 $ (39,548) $ 33,347 $ 35,951 $ (2,992) $ 52,290 $ (6,387) $ 45,903
Identifiable assets . . . . . . . . . . . . . $2,340,734 $403,242 $279,379 $ 960,669 $132,476 $4,116,500 $ 614,371 $4,730,871
Depreciation & amortization . . . . 119,734 18,065 41,669 37,629 6,516 223,613 2,879 226,492
Capital expenditures . . . . . . . . . . . 130,234 17,193 40,226 58,500 4,597 250,750 274 251,024
< 38 VICTOR COMPANY OF JAPAN, LIMITED 39 >