JVC 2001 Annual Report Download - page 21
Download and view the complete annual report
Please find page 21 of the 2001 JVC annual report below. You can navigate through the pages in the report by either clicking on the pages listed below, or by using the keyword search tool below to find specific information within the annual report.-
 1
1 -
2
-
3
-
4
-
5
-
6
-
7
-
8
-
9
-
10
-
 11
11 -
 12
12 -
 13
13 -
 14
14 -
 15
15 -
 16
16 -
 17
17 -
 18
18 -
 19
19 -
 20
20 -
 21
21 -
 22
22 -
 23
23 -
 24
24 -
 25
25 -
 26
26 -
 27
27 -
 28
28 -
 29
29 -
 30
30 -
 31
31 -
32
-
33
-
34
-
35
-
36
-
37
-
38
-
39
-
40
-
41
-
42
-
43
-
44
-
45
-
46
-
47
-
48
 |
 |

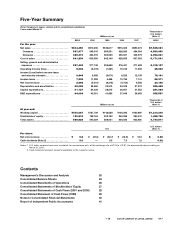
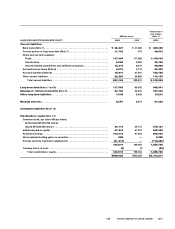
Five-Year Summary
Victor Company of Japan, Limited and its consolidated subsidiaries
Years ended March 31
Thousands of
U.S. dollars
Millions of yen (Note 1)
2001 2000 1999 1998 1997 2001
For the year:
Net sales . . . . . . . . . . . . . . . . . . . . . . . . . . . . . ¥934,350 ¥870,235 ¥946,617 ¥916,306 ¥890,373 $7,535,081
Overseas . . . . . . . . . . . . . . . . . . . . . . . . . . . 567,977 545,316 566,551 526,285 484,394 4,580,460
Domestic . . . . . . . . . . . . . . . . . . . . . . . . . . . 366,373 324,919 380,066 390,021 405,979 2,954,621
Cost of sales . . . . . . . . . . . . . . . . . . . . . . . . . . 641,209 600,506 642,140 629,859 607,383 5,171,041
Selling, general and administrative
expenses . . . . . . . . . . . . . . . . . . . . . . . . . . . . 287,449 277,748 305,698 276,431 271,482 2,318,137
Operating Income (loss) . . . . . . . . . . . . . . . . . 5,692 (8,019) (1,221) 10,016 11,508 45,903
Income (Loss) before income taxes
and minority interests . . . . . . . . . . . . . . . . . . 9,444 6,088 (3,671) 6,223 12,139 76,161
Income taxes . . . . . . . . . . . . . . . . . . . . . . . . . . 7,238 11,295 4,466 10,796 7,141 58,371
Net income (loss) . . . . . . . . . . . . . . . . . . . . . . 2,498 (5,341) (8,315) (4,703) 4,586 20,145
Depreciation and amortization . . . . . . . . . . . 28,085 28,590 30,513 24,008 27,212 226,492
Capital expenditures . . . . . . . . . . . . . . . . . . . . 31,127 24,336 28,815 36,651 31,552 251,024
R&D expenditures . . . . . . . . . . . . . . . . . . . . . . 44,094 43,351 41,660 37,649 39,563 355,597
Thousands of
U.S. dollars
Millions of yen (Note 1)
At year-end:
Working capital . . . . . . . . . . . . . . . . . . . . . . . . ¥150,067 ¥127,709 ¥142,628 ¥124,395 ¥160,869 $1,210,218
Stockholders’ equity . . . . . . . . . . . . . . . . . . . . 180,515 199,164 232,162 243,086 250,418 1,455,766
Total assets . . . . . . . . . . . . . . . . . . . . . . . . . . . 586,628 540,359 588,001 624,050 603,920 4,730,871
U.S. dollars
Yen (Note 1)
Per share:
Net income (loss) . . . . . . . . . . . . . . . . . . . . . . ¥ 9.8 ¥ (21.0) ¥ (32.7) ¥ (18.5) ¥ 18.0 $ 0.08
Cash dividends (Note 2) . . . . . . . . . . . . . . . . . 3.0 — 5.0 7.0 7.0 0.02
Notes: 1. U.S. dollar amounts have been translated, for convenience only, at the exchange rate of ¥124 to U.S.$1, the approximate rate prevailing on
March 31, 2001.
2. Cash dividends represent amounts applicable to the respective years.
Contents
Management’s Discussion and Analysis 20
Consolidated Balance Sheets 24
Consolidated Statements of Operations 26
Consolidated Statements of Stockholders’ Equity 27
Consolidated Statements of Cash Flows (2001 and 2000) 28
Consolidated Statement of Cash Flows (1999) 29
Notes to Consolidated Financial Statements 30
Report of Independent Public Accountants 41
< 18 VICTOR COMPANY OF JAPAN, LIMITED 19 >