JVC 2001 Annual Report Download - page 30
Download and view the complete annual report
Please find page 30 of the 2001 JVC annual report below. You can navigate through the pages in the report by either clicking on the pages listed below, or by using the keyword search tool below to find specific information within the annual report.-
 1
1 -
2
-
3
-
4
-
5
-
6
-
7
-
8
-
9
-
10
-
11
-
12
-
13
-
14
-
15
-
16
-
17
-
18
-
19
-
 20
20 -
 21
21 -
 22
22 -
 23
23 -
 24
24 -
 25
25 -
 26
26 -
 27
27 -
 28
28 -
 29
29 -
 30
30 -
 31
31 -
 32
32 -
 33
33 -
 34
34 -
 35
35 -
 36
36 -
 37
37 -
 38
38 -
 39
39 -
 40
40 -
41
-
42
-
43
-
44
-
45
-
46
-
47
-
48
 |
 |

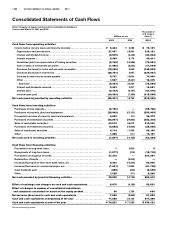
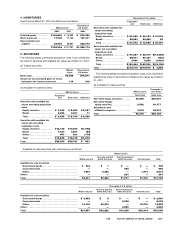
Consolidated Statements of Cash Flows
Victor Company of Japan, Limited and its consolidated subsidiaries
Years ended March 31, 2001 and 2000
Thousands of
U.S. dollars
Millions of yen (Note 1)
2001 2000 2001
Cash flows from operating activities:
Income before income taxes and minority interests . . . . . . . . . . . . . . . . . . . . . . . . . ¥9,444 ¥6,088 $ 76,161
Depreciation and amortization . . . . . . . . . . . . . . . . . . . . . . . . . . . . . . . . . . . . . . . . . 27,047 28,953 218,121
Interest and dividend income . . . . . . . . . . . . . . . . . . . . . . . . . . . . . . . . . . . . . . . . . . (2,509) (2,408) (20,234)
Interest expense . . . . . . . . . . . . . . . . . . . . . . . . . . . . . . . . . . . . . . . . . . . . . . . . . . . . 5,383 6,178 43,411
Unrealized gain from appreciation of trading securities . . . . . . . . . . . . . . . . . . . . (9,749) (16,386) (78,621)
Gain on sales of investment securities . . . . . . . . . . . . . . . . . . . . . . . . . . . . . . . . . . (1,450) (6,330) (11,694)
Decrease (Increase) in notes and accounts receivable . . . . . . . . . . . . . . . . . . . . . (18,046) 5,069 (145,532)
Decrease (Increase) in inventories . . . . . . . . . . . . . . . . . . . . . . . . . . . . . . . . . . . . . . (29,751) 3,667 (239,927)
Increase in notes and accounts payable . . . . . . . . . . . . . . . . . . . . . . . . . . . . . . . . . 8,737 10,634 70,460
Other . . . . . . . . . . . . . . . . . . . . . . . . . . . . . . . . . . . . . . . . . . . . . . . . . . . . . . . . . . . . . . 1,527 (5,441) 12,315
Sub-total . . . . . . . . . . . . . . . . . . . . . . . . . . . . . . . . . . . . . . . . . . . . . . . . . . . . . . . . . (9,367) 30,024 (75,540)
Interest and dividends received . . . . . . . . . . . . . . . . . . . . . . . . . . . . . . . . . . . . . . . . 2,433 2,307 19,621
Interest paid . . . . . . . . . . . . . . . . . . . . . . . . . . . . . . . . . . . . . . . . . . . . . . . . . . . . . . . . (5,143) (6,180) (41,476)
Income taxes paid . . . . . . . . . . . . . . . . . . . . . . . . . . . . . . . . . . . . . . . . . . . . . . . . . . . (14,330) (7,389) (115,565)
Net cash (used in) provided by operating activities . . . . . . . . . . . . . . . . . . . . . . . (26,407) 18,762 (212,960)
Cash flows from investing activities:
Purchases of time deposits . . . . . . . . . . . . . . . . . . . . . . . . . . . . . . . . . . . . . . . . . . . . . (8,150) —(65,726)
Purchases of property, plant and equipment . . . . . . . . . . . . . . . . . . . . . . . . . . . . . . . (28,942) (23,121) (233,403)
Proceeds from sales of property, plant and equipment . . . . . . . . . . . . . . . . . . . . . . 4,883 319 39,379
Purchases of marketable securities . . . . . . . . . . . . . . . . . . . . . . . . . . . . . . . . . . . . . . (43,687) (59,983) (352,315)
Sales of marketable securities . . . . . . . . . . . . . . . . . . . . . . . . . . . . . . . . . . . . . . . . . . . 63,612 66,813 513,000
Purchases of investment securities . . . . . . . . . . . . . . . . . . . . . . . . . . . . . . . . . . . . . . (3,552) (10,809) (28,645)
Sales of investment securities . . . . . . . . . . . . . . . . . . . . . . . . . . . . . . . . . . . . . . . . . . . 6,714 11,999 54,145
Other . . . . . . . . . . . . . . . . . . . . . . . . . . . . . . . . . . . . . . . . . . . . . . . . . . . . . . . . . . . . . . . . 1,255 614 10,121
Net cash used in investing activities . . . . . . . . . . . . . . . . . . . . . . . . . . . . . . . . . . . . (7,867) (14,168) (63,444)
Cash flows from financing activities:
Proceeds from long-term loans . . . . . . . . . . . . . . . . . . . . . . . . . . . . . . . . . . . . . . . . . . 13,603 8
Repayments of long-term loans . . . . . . . . . . . . . . . . . . . . . . . . . . . . . . . . . . . . . . . . . (1,577) (316) (12,718)
Proceeds from issuance of bonds . . . . . . . . . . . . . . . . . . . . . . . . . . . . . . . . . . . . . . . . 37,372 —301,387
Redemption of bonds . . . . . . . . . . . . . . . . . . . . . . . . . . . . . . . . . . . . . . . . . . . . . . . . . . —(9,040) —
Increase (Decrease) in short-term bank loans, net . . . . . . . . . . . . . . . . . . . . . . . . . . 6,300 (15,549) 50,806
Increase (Decrease) in commercial paper, net. . . . . . . . . . . . . . . . . . . . . . . . . . . . . . (7,661) 10,884 (61,782)
Cash dividends paid . . . . . . . . . . . . . . . . . . . . . . . . . . . . . . . . . . . . . . . . . . . . . . . . . . . (255) (632) (2,055)
Other . . . . . . . . . . . . . . . . . . . . . . . . . . . . . . . . . . . . . . . . . . . . . . . . . . . . . . . . . . . . . . . . 1,025 315 8,266
Net cash provided by (used in) financing activities . . . . . . . . . . . . . . . . . . . . . . . . 35,205 (10,735) 283,912
Effect of exchange rate changes on cash and cash equivalents . . . . . . . . . . . . 6,675 (4,188) 53,831
Effect of changes in number of consolidated subsidiaries
and companies accounted for based on the equity method . . . . . . . . . . . . . . . 60 1,764 484
Net increase (decrease) in cash and cash equivalents . . . . . . . . . . . . . . . . . . . . 7,666 (8,565) 61,823
Cash and cash equivalents at beginning of the year . . . . . . . . . . . . . . . . . . . . . . 71,585 80,150 577,298
Cash and cash equivalents at end of the year . . . . . . . . . . . . . . . . . . . . . . . . . . . . ¥79,251 ¥71,585 $ 639,121
See accompanying notes.
< 28 VICTOR COMPANY OF JAPAN, LIMITED 29 >