JVC 2001 Annual Report Download - page 42
Download and view the complete annual report
Please find page 42 of the 2001 JVC annual report below. You can navigate through the pages in the report by either clicking on the pages listed below, or by using the keyword search tool below to find specific information within the annual report.-
 1
1 -
2
-
3
-
4
-
5
-
6
-
7
-
8
-
9
-
10
-
11
-
12
-
13
-
14
-
15
-
16
-
17
-
18
-
19
-
20
-
21
-
22
-
23
-
24
-
25
-
26
-
27
-
28
-
29
-
30
-
31
-
 32
32 -
 33
33 -
 34
34 -
 35
35 -
 36
36 -
 37
37 -
 38
38 -
 39
39 -
 40
40 -
 41
41 -
 42
42 -
 43
43 -
 44
44 -
 45
45 -
 46
46 -
 47
47 -
 48
48
 |
 |

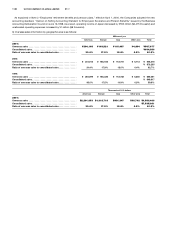
As explained in Note 2 “Employees’ retirement benefits and pension plans,” effective April 1, 2000, the Companies adopted the new
accounting standard, “Opinion on Setting Accounting Standard for Employees’ Severance and Pension Benefits,” issued by the Business
Accounting Deliberation Council on June 16,1998. As a result, operating income of Japan decreased by ¥555 million ($4,475 thousand) and
unallocated operating expenses increased by ¥1 million ($8 thousand).
3) Overseas sales information by geographic area is as follows:
Millions of yen
Americas Europe Asia Other area Total
2001:
Overseas sales . . . . . . . . . . . . . . . . . . . . . . . . . . . . . . . . . . . . . . . . ¥284,165 ¥163,521 ¥115,487 ¥4,804 ¥567,977
Consolidated sales . . . . . . . . . . . . . . . . . . . . . . . . . . . . . . . . . . . . . ¥934,350
Ratio of overseas sales to consolidated sales . . . . . . . . . . . . . . . 30.4% 17.5% 12.4% 0.5% 60.8%
2000:
Overseas sales . . . . . . . . . . . . . . . . . . . . . . . . . . . . . . . . . . . . . . . . ¥ 273,012 ¥155,440 ¥112,751 ¥4,113 ¥545,316
Consolidated sales . . . . . . . . . . . . . . . . . . . . . . . . . . . . . . . . . . . . . ¥ 870,235
Ratio of overseas sales to consolidated sales . . . . . . . . . . . . . . . 31.4% 17.9% 13.0% 0.4% 62.7%
1999:
Overseas sales . . . . . . . . . . . . . . . . . . . . . . . . . . . . . . . . . . . . . . . . ¥ 284,099 ¥165,320 ¥112,782 ¥4,350 ¥566,551
Consolidated sales . . . . . . . . . . . . . . . . . . . . . . . . . . . . . . . . . . . . . ¥ 946,617
Ratio of overseas sales to consolidated sales . . . . . . . . . . . . . . . 30.0% 17.5% 11.9% 0.5% 59.9%
Thousands of U.S. dollars
Americas Europe Asia Other area Total
2001:
Overseas sales . . . . . . . . . . . . . . . . . . . . . . . . . . . . . . . . . . . . . . . . $2,291,653 $1,318,718 $931,347 $38,742 $4,580,460
Consolidated sales . . . . . . . . . . . . . . . . . . . . . . . . . . . . . . . . . . . . . $7,535,081
Ratio of overseas sales to consolidated sales . . . . . . . . . . . . . . . 30.4% 17.5% 12.4% 0.5% 60.8%
< 40 VICTOR COMPANY OF JAPAN, LIMITED 41 >