JVC 2001 Annual Report Download - page 23
Download and view the complete annual report
Please find page 23 of the 2001 JVC annual report below. You can navigate through the pages in the report by either clicking on the pages listed below, or by using the keyword search tool below to find specific information within the annual report.-
 1
1 -
2
-
3
-
4
-
5
-
6
-
7
-
8
-
9
-
10
-
11
-
12
-
 13
13 -
 14
14 -
 15
15 -
 16
16 -
 17
17 -
 18
18 -
 19
19 -
 20
20 -
 21
21 -
 22
22 -
 23
23 -
 24
24 -
 25
25 -
 26
26 -
 27
27 -
 28
28 -
 29
29 -
 30
30 -
 31
31 -
 32
32 -
 33
33 -
34
-
35
-
36
-
37
-
38
-
39
-
40
-
41
-
42
-
43
-
44
-
45
-
46
-
47
-
48
 |
 |
< 20 VICTOR COMPANY OF JAPAN, LIMITED 21 >
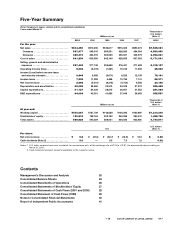
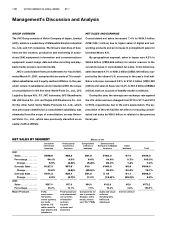
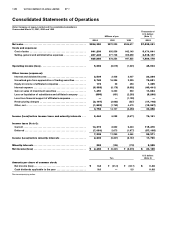
The cost of sales increased 6.8%, in line with higher net
sales, to ¥641.2 billion (US$5,171.0 million). The cost of sales
ratio improved by 0.4 of a percentage point to 68.6%, how-
ever, thanks to structural reforms implemented since last year
and other efforts to limit growth in the cost of sales.
Selling, general and administrative (SG&A) expenses also
tracked the growth in net sales, rising 3.5% to ¥287.4 billion
(US$2,318.1 million). As a percentage of net sales, SG&A
expenses improved 1.1 percentage points to 30.8%.
As a result of the above, JVC reversed a fiscal 1999
operating loss of ¥8.0 billion to post operating income of
¥5.7 billion (US$45.9 million).
In other income and expenses, JVC booked expenses for
a special retirement program and took restructuring charges,
including costs for business structural reforms. These
expenses were offset by gains on the sale of shares and the
sale of property, plant and equipment.
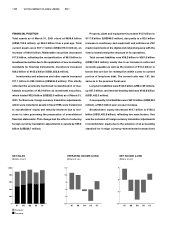
Income before income taxes and minority interests was
¥9.4 billion (US$76.2 million), up 55.2% year on year. Net
income was ¥2.5 billion (US$20.1 million), compared with a
net loss of ¥5.3 billion in the previous fiscal year. Accordingly,
net income per share was ¥9.8, compared with a net loss
per share of ¥21.0 in fiscal 1999. ROE was 1.38%, compared
with –2.68%.
SEGMENT INFORMATION
Sales of Consumer Electronics increased 5.5% to ¥598.6
billion (US$4,828 million). This principally reflected sharp
growth in DVD players accompanying the rising popularity of
DVD software, as well as strong demand for digital video
camcorders, micro component systems and car audio
systems destined for overseas. Segment operating income
increased from ¥0.4 billion to ¥3.2 billion (US$26 million).
Sales of Professional Electronics declined 4.5% to
¥83.9 billion (US$677 million) due primarily to fierce
competition overseas in digital video decks for broadcasting
and delays in rolling out new D-ILA (Direct-Drive Image Light
Amplifier) projectors. Offsetting these decreases somewhat
were higher sales of professional audio systems and secu-
rity camera systems as more large-scale retail stores were
opened, and solid demand for satellite distribution systems,
uplink converters for BS digital broadcasters and other new
products. The segment posted an operating loss of ¥4.9 billion
(US$40 million), compared with an operating loss of ¥7.9 billion
in the previous fiscal year.
Sales of Components & Devices decreased 5.1% to
¥61.5 billion (US$496 million) due to a number of factors.
Firstly, sales of deflection yokes dropped because of a slow-
down in demand in the U.S. PC market. Sales were also hurt
by lower orders as customers moved production overseas
and by falling prices. Contrastingly, sales of high-density
build-up multilayer printed wiring boards (“VIL” PWBs) rose
35%, despite a downturn in the mobile phone market. Motors
used predominantly in floppy disk drives (FDDs), meanwhile,
posted steady sales, despite falling sales prices and the yen’s
strength. The segment recorded operating income of ¥4.1
billion (US$33 million), reversing a previous-year operating
loss of ¥2.4 billion.
Sales of Entertainment Softwares & Medias climbed
28.2% to ¥183.3 billion (US$1,478 million). This reflected strong
sales of hit albums from the “Southern All Stars” and “SMAP,”
higher consignment sales for Universal Music K.K. and the
contribution of domestic subsidiary Teichiku Entertainment,
Inc. Segment operating income increased from ¥3.0 billion
to ¥4.5 billion (US$36 million).
Sales of Other increased 0.6% to ¥7.0 billion (US$56
million) due to robust sales for interior furniture. Even so, the
segment operating loss widened from ¥0.19 billion to ¥0.37
billion (US$3 million).