JVC 2001 Annual Report Download - page 41
Download and view the complete annual report
Please find page 41 of the 2001 JVC annual report below. You can navigate through the pages in the report by either clicking on the pages listed below, or by using the keyword search tool below to find specific information within the annual report.-
 1
1 -
2
-
3
-
4
-
5
-
6
-
7
-
8
-
9
-
10
-
11
-
12
-
13
-
14
-
15
-
16
-
17
-
18
-
19
-
20
-
21
-
22
-
23
-
24
-
25
-
26
-
27
-
28
-
29
-
30
-
 31
31 -
 32
32 -
 33
33 -
 34
34 -
 35
35 -
 36
36 -
 37
37 -
 38
38 -
 39
39 -
 40
40 -
 41
41 -
 42
42 -
 43
43 -
 44
44 -
 45
45 -
 46
46 -
 47
47 -
 48
48
 |
 |

As explained in Note 2 “Employees’ retirement benefits and pension plans,” effective April 1, 2000, the Companies adopted the new
accounting standard, “Opinion on Setting Accounting Standard for Employees’ Severance and Pension Benefits,” issued by the Business
Accounting Deliberation Council on June 16, 1998. As a result, operating income of Consumer electronics business decreased by ¥235
million ($1,895 thousand), operating loss of Professional electronics business increased by ¥83 million ($669 thousand), operating income of
Components & Devices business decreased by ¥70 million ($564 thousand), operating income of Entertainment Softwares & Medias business
decreased by ¥145 million ($1,169 thousand), operating loss of Other business increased by ¥20 million ($161 thousand) and unallocated
operating expenses increased by ¥1 million ($8 thousand).
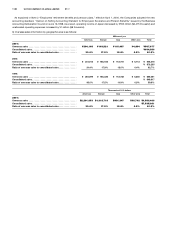
2) Geographical segment information is as follows:
Millions of yen
Elimination and Consolidated
Japan Americas Europe Asia Total unallocation total
2001:
Sales
External sales . . . . . . . . . . . . . . . . ¥454,626 ¥261,185 ¥151,269 ¥67,270 ¥934,350 ¥—¥934,350
Intersegment sales . . . . . . . . . . . . 263,473 182 873 170,233 434,761 (434,761) —
Total sales . . . . . . . . . . . . . . . . . . . 718,099 261,367 152,142 237,503 1,369,111 (434,761) 934,350
Operating expenses . . . . . . . . . . . . . 716,531 258,272 150,301 236,238 1,361,342 (432,684) 928,658
Operating income (loss) . . . . . . . . . . ¥1,568 ¥3,095 ¥1,841 ¥1,265 ¥7,769 ¥(2,077) ¥5,692
Identifiable assets . . . . . . . . . . . . . . . ¥379,008 ¥99,105 ¥67,343 ¥75,655 ¥621,111 ¥(34,483) ¥586,628
Millions of yen
Elimination and Consolidated
Japan Americas Europe Asia Total unallocation total
2000:
Sales
External sales . . . . . . . . . . . . . . . . ¥416,271 ¥249,451 ¥145,709 ¥58,804 ¥870,235 ¥—¥870,235
Intersegment sales . . . . . . . . . . . . 238,687 431 183 141,377 380,678 (380,678) —
Total sales . . . . . . . . . . . . . . . . . . . 654,958 249,882 145,892 200,181 1,250,913 (380,678) 870,235
Operating expenses . . . . . . . . . . . . . 671,232 247,581 144,276 198,170 1,261,259 (383,005) 878,254
Operating income (loss) . . . . . . . . . . ¥(16,274) ¥2,301 ¥1,616 ¥2,011 ¥(10,346) ¥2,327 ¥(8,019)
Identifiable assets . . . . . . . . . . . . . . . ¥359,991 ¥110,231 ¥ 52,158 ¥ 57,298 ¥ 579,678 ¥(39,319) ¥540,359
Millions of yen
Elimination and Consolidated
Japan Americas Europe Asia Total unallocation total
1999:
Sales
External sales . . . . . . . . . . . . . . . . ¥474,911 ¥263,530 ¥156,044 ¥52,132 ¥946,617 ¥—¥946,617
Intersegment sales . . . . . . . . . . . . 246,614 798 146 122,817 370,375 (370,375) —
Total sales . . . . . . . . . . . . . . . . . . . 721,525 264,328 156,190 174,949 1,316,992 (370,375) 946,617
Operating expenses . . . . . . . . . . . . . 718,296 265,448 155,913 175,655 1,315,312 (367,474) 947,838
Operating income (loss) . . . . . . . . . . ¥3,229 ¥(1,120) ¥277 ¥(706) ¥1,680 ¥(2,901) ¥(1,221)
Identifiable assets . . . . . . . . . . . . . . . ¥378,124 ¥ 93,712 ¥ 64,676 ¥ 59,943 ¥ 596,455 ¥(8,454) ¥588,001
Thousands of U.S. dollars
Elimination and Consolidated
Japan Americas Europe Asia Total unallocation total
2001:
Sales
External sales . . . . . . . . . . . . . . $3,666,339 $2,106,331 $1,219,911 $ 542,500 $ 7,535,081 $ —$7,535,081
Intersegment sales . . . . . . . . . . 2,124,782 1,467 7,041 1,372,847 3,506,137 (3,506,137) —
Total sales . . . . . . . . . . . . . . . . . 5,791,121 2,107,798 1,226,952 1,915,347 11,041,218 (3,506,137) 7,535,081
Operating expenses . . . . . . . . . . . 5,778,476 2,082,839 1,212,105 1,905,145 10,978,565 (3,489,387) 7,489,178
Operating income (loss) . . . . . . . . $ 12,645 $ 24,959 $ 14,847 $ 10,202 $ 62,653 $ (16,750) $ 45,903
Identifiable assets . . . . . . . . . . . . . $3,056,516 $ 799,234 $ 543,089 $ 610,121 $ 5,008,960 $ (278,089) $4,730,871
< 38 VICTOR COMPANY OF JAPAN, LIMITED 39 >