Fujitsu 2012 Annual Report Download - page 13
Download and view the complete annual report
Please find page 13 of the 2012 Fujitsu annual report below. You can navigate through the pages in the report by either clicking on the pages listed below, or by using the keyword search tool below to find specific information within the annual report.-
 1
1 -
2
-
 3
3 -
 4
4 -
 5
5 -
 6
6 -
 7
7 -
 8
8 -
 9
9 -
 10
10 -
 11
11 -
 12
12 -
 13
13 -
 14
14 -
 15
15 -
 16
16 -
 17
17 -
 18
18 -
 19
19 -
 20
20 -
 21
21 -
 22
22 -
 23
23 -
24
-
25
-
26
-
27
-
28
-
29
-
30
-
31
-
32
-
33
-
34
-
35
-
36
-
37
-
38
-
39
-
40
-
41
-
42
-
43
-
44
-
45
-
46
-
47
-
48
-
49
-
50
-
51
-
52
-
53
-
54
-
55
-
56
-
57
-
58
-
59
-
60
-
61
-
62
-
63
-
64
-
65
-
66
-
67
-
68
-
69
-
70
-
71
-
72
-
73
-
74
-
75
-
76
-
77
-
78
-
79
-
80
-
81
-
82
-
83
-
84
-
85
-
86
-
87
-
88
-
89
-
90
-
91
-
92
-
93
-
94
-
95
-
96
-
97
-
98
-
99
-
100
-
101
-
102
-
103
-
104
-
105
-
106
-
107
-
108
-
109
-
110
-
111
-
112
-
113
-
114
-
115
-
116
-
117
-
118
-
119
-
120
-
121
-
122
-
123
-
124
-
125
-
126
-
127
-
128
-
129
-
130
-
131
-
132
-
133
-
134
-
135
-
136
-
137
-
138
-
139
-
140
-
141
-
142
-
143
-
144
-
145
 |
 |

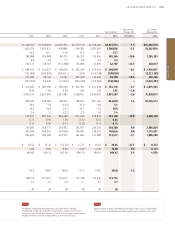
Non-financial Data (ESG Indicators)
Capital Expenditure
Trends in Total Greenhouse Gas Emissions
(Whole Group and Global)
Trends in Women Managers
(Non-Consolidated)
Percentage of Outside Directors
(Non-Consolidated)
Interest-Bearing Loans and
D/E Ratio
Cash Dividends
R&D Expenses
(¥ Billions)
(¥ Billions) (Times)
(Yen)
(¥ Billions)
(Years ended March 31)
(Years ended March 31) (Years ended March 31) (Years ended March 31)
(As of March 31)
(Years ended March 31)
(Years ended March 31)
n n
Interest-bearing loans (left scale)
D/E ratio (right scale)
0
100
300
200
2008 20102009 2011 2012
249.0
140.6
130.2
126.4
167.6
0
600
300
1,200
900
2008 20102009 2011 2012
887.3
0.94 381.1
470.8
0.57
577.4
883.4
1.18
0.72
2.0
1.5
1.0
0.5
0
0.45
0
3
6
12
9
2008 20102009 2011 2012
8.00
10.00
10.00
8.008.00
0
100
300
200
2008 20102009 2011 2012
258.7 238.3
236.2
224.9
249.9
0
50
100
250
200
150
189.4
109.8
118.5
131.3
166.8
2008 20102009 2011 2012 0
1.0
2.0
5.0
4.0
3.0
2.4
3.5
2.9
3.1
2008 20102009 2011 2012
3.7
0
10
20
50
40
30
20
30
20
30
2008 20102009 2011 2012
36
(10,000 tons) (%) (%)
D/E Ratio
R&D Expenses
Capital Expenditure
–0.12Point
+0.9%
+8.0%
011
FUJITSU LIMITED ANNUAL REPORT 2012
Management