Fujitsu 2012 Annual Report Download - page 10
Download and view the complete annual report
Please find page 10 of the 2012 Fujitsu annual report below. You can navigate through the pages in the report by either clicking on the pages listed below, or by using the keyword search tool below to find specific information within the annual report.-
 1
1 -
 2
2 -
 3
3 -
 4
4 -
 5
5 -
 6
6 -
 7
7 -
 8
8 -
 9
9 -
 10
10 -
 11
11 -
 12
12 -
 13
13 -
 14
14 -
 15
15 -
 16
16 -
 17
17 -
 18
18 -
 19
19 -
 20
20 -
 21
21 -
22
-
23
-
24
-
25
-
26
-
27
-
28
-
29
-
30
-
31
-
32
-
33
-
34
-
35
-
36
-
37
-
38
-
39
-
40
-
41
-
42
-
43
-
44
-
45
-
46
-
47
-
48
-
49
-
50
-
51
-
52
-
53
-
54
-
55
-
56
-
57
-
58
-
59
-
60
-
61
-
62
-
63
-
64
-
65
-
66
-
67
-
68
-
69
-
70
-
71
-
72
-
73
-
74
-
75
-
76
-
77
-
78
-
79
-
80
-
81
-
82
-
83
-
84
-
85
-
86
-
87
-
88
-
89
-
90
-
91
-
92
-
93
-
94
-
95
-
96
-
97
-
98
-
99
-
100
-
101
-
102
-
103
-
104
-
105
-
106
-
107
-
108
-
109
-
110
-
111
-
112
-
113
-
114
-
115
-
116
-
117
-
118
-
119
-
120
-
121
-
122
-
123
-
124
-
125
-
126
-
127
-
128
-
129
-
130
-
131
-
132
-
133
-
134
-
135
-
136
-
137
-
138
-
139
-
140
-
141
-
142
-
143
-
144
-
145
 |
 |

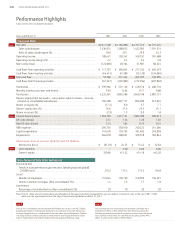
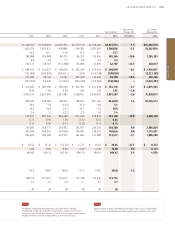
Performance Highlights
Fujitsu Limited and Consolidated Subsidiaries
Years ended March 31 2003 2004 2005 2006
Net sales . . . . . . . . . . . . . . . . . . . . . . . . . . . . . . . . . . . . . . . . . . . . . . . . . . . . . ¥4,617,580 ¥4,766,888 ¥4,762,759 ¥4,791,416
Sales outside Japan . . . . . . . . . . . . . . . . . . . . . . . . . . . . . . . . . . . . . . . . . . . 1,336,915 1,388,623 1,422,095 1,591,574
Ratio of sales outside Japan (%) . . . . . . . . . . . . . . . . . . . . . . . . . . . . . . . . . 29.0 29.1 29.9 33.2
Operating income . . . . . . . . . . . . . . . . . . . . . . . . . . . . . . . . . . . . . . . . . . . . . . 100,427 150,342 160,191 181,488
Operating income margin (%) . . . . . . . . . . . . . . . . . . . . . . . . . . . . . . . . . . . . 2.2 3.2 3.4 3.8
Net income (loss) . . . . . . . . . . . . . . . . . . . . . . . . . . . . . . . . . . . . . . . . . . . . . . (122,066) 49,704 31,907 68,545
Cash flows from operating activities . . . . . . . . . . . . . . . . . . . . . . . . . . . . . . . . ¥ 117,797 ¥ 304,045 ¥ 277,232 ¥ 405,579
Cash flows from investing activities . . . . . . . . . . . . . . . . . . . . . . . . . . . . . . . . (64,415) 67,389 (15,129) (234,684)
Free cash flow . . . . . . . . . . . . . . . . . . . . . . . . . . . . . . . . . . . . . . . . . . . . . . . . . 53,382 371,434 262,103 170,895
Cash flows from financing activities . . . . . . . . . . . . . . . . . . . . . . . . . . . . . . . . (67,237) (239,902) (212,034) (207,840)
Inventories. . . . . . . . . . . . . . . . . . . . . . . . . . . . . . . . . . . . . . . . . . . . . . . . . . . . ¥ 595,984 ¥ 521,126 ¥ 478,510 ¥ 408,710
Monthly inventory turnover rate (times) . . . . . . . . . . . . . . . . . . . . . . . . . . . . 0.59 0.64 0.71 0.88
Total assets . . . . . . . . . . . . . . . . . . . . . . . . . . . . . . . . . . . . . . . . . . . . . . . . . . . 4,225,361 3,865,589 3,640,198 3,807,131
Owners’ equity (total net assets – subscription rights to shares – minority
interests in consolidated subsidiaries) . . . . . . . . . . . . . . . . . . . . . . . . . . . . . 702,390 827,177 856,990 917,045
Return on equity (%) . . . . . . . . . . . . . . . . . . . . . . . . . . . . . . . . . . . . . . . . . . . . (17.4) 6.0 3.7 7.7
Owners’ equity ratio (%) . . . . . . . . . . . . . . . . . . . . . . . . . . . . . . . . . . . . . . . . . 16.6 21.4 23.5 24.1
Return on assets (%) . . . . . . . . . . . . . . . . . . . . . . . . . . . . . . . . . . . . . . . . . . . . (2.9) 1.3 0.9 1.8
Interest-bearing loans . . . . . . . . . . . . . . . . . . . . . . . . . . . . . . . . . . . . . . . . . . . 1,763,769 1,277,121 1,082,788 928,613
D/E ratio (times) . . . . . . . . . . . . . . . . . . . . . . . . . . . . . . . . . . . . . . . . . . . . . . . 2.51 1.54 1.26 1.01
Net D/E ratio (times) . . . . . . . . . . . . . . . . . . . . . . . . . . . . . . . . . . . . . . . . . . . . 2.14 1.04 0.73 0.55
R&D expenses . . . . . . . . . . . . . . . . . . . . . . . . . . . . . . . . . . . . . . . . . . . . . . . . . 285,735 250,910 240,222 241,566
Capital expenditure . . . . . . . . . . . . . . . . . . . . . . . . . . . . . . . . . . . . . . . . . . . . . 147,620 159,795 181,402 249,999
Depreciation . . . . . . . . . . . . . . . . . . . . . . . . . . . . . . . . . . . . . . . . . . . . . . . . . . 264,678 200,031 169,918 169,843
Amounts per share of common stock (Yen and U.S. Dollars):
Net income (loss) . . . . . . . . . . . . . . . . . . . . . . . . . . . . . . . . . . . . . . . . . . . . ¥ (61.29) ¥ 24.55 ¥ 15.42 ¥ 32.83
Cash dividends . . . . . . . . . . . . . . . . . . . . . . . . . . . . . . . . . . . . . . . . . . . . . . — 3.00 6.00 6.00
Owners’ equity . . . . . . . . . . . . . . . . . . . . . . . . . . . . . . . . . . . . . . . . . . . . . . . 350.84 413.22 414.18 443.20
Environmental
Trends in total greenhouse gas emissions (whole group and global)
(10,000 tons) . . . . . . . . . . . . . . . . . . . . . . . . . . . . . . . . . . . . . . . . . . . . . . . 210.2 175.5 175.5 159.8
Social
Number of employees . . . . . . . . . . . . . . . . . . . . . . . . . . . . . . . . . . . . . . . . . 157,044 156,169 150,970 158,491
Trends in women managers (Non-consolidated) (%) . . . . . . . . . . . . . . . . 1.4 1.6 1.7 1.8
Governance
Percentage of outside directors (Non-consolidated) (%) . . . . . . . . . . . . . . 29 10 20 20
Note: The U.S. dollar amounts stated above and elsewhere in this report have been translated from yen, for readers’ convenience only, at the rate of ¥82 = US$1,
which was the approximate rate on the Tokyo Foreign Exchange Market on March 31, 2012.
POINT 1
POINT 2
POINT 4
POINT 3
Financial Data
Non-financial Data (ESG Indicators)
POINT 1
In fiscal 2011, consolidated net sales declined ¥60.8 billion year on year, to ¥4,467.5 billion.
Excluding the impact of exchange rate fluctuations, net sales were on par with the previous
fiscal year. Negative factors, including effects from lower sales caused by flooding in Thailand
and a drop in Device Solutions sales due to weak demand, were largely offset by increased
sales of mobile phones and network products driven by growing smartphone usage.
POINT 2
Free cash flow (the sum of operating and investment cash flows) was a
positive ¥49.1 billion, or ¥64.2 billion less than the previous fiscal year.
Excluding proceeds from the sale of investment securities and other special
items reported in fiscal 2010, free cash flow was actually a positive ¥43.5
billion, or a year-on-year decline of ¥29.8 billion.
008 FUJITSU LIMITED ANNUAL REPORT 2012