Fujitsu 2012 Annual Report Download - page 12
Download and view the complete annual report
Please find page 12 of the 2012 Fujitsu annual report below. You can navigate through the pages in the report by either clicking on the pages listed below, or by using the keyword search tool below to find specific information within the annual report.-
 1
1 -
 2
2 -
 3
3 -
 4
4 -
 5
5 -
 6
6 -
 7
7 -
 8
8 -
 9
9 -
 10
10 -
 11
11 -
 12
12 -
 13
13 -
 14
14 -
 15
15 -
 16
16 -
 17
17 -
 18
18 -
 19
19 -
 20
20 -
 21
21 -
 22
22 -
23
-
24
-
25
-
26
-
27
-
28
-
29
-
30
-
31
-
32
-
33
-
34
-
35
-
36
-
37
-
38
-
39
-
40
-
41
-
42
-
43
-
44
-
45
-
46
-
47
-
48
-
49
-
50
-
51
-
52
-
53
-
54
-
55
-
56
-
57
-
58
-
59
-
60
-
61
-
62
-
63
-
64
-
65
-
66
-
67
-
68
-
69
-
70
-
71
-
72
-
73
-
74
-
75
-
76
-
77
-
78
-
79
-
80
-
81
-
82
-
83
-
84
-
85
-
86
-
87
-
88
-
89
-
90
-
91
-
92
-
93
-
94
-
95
-
96
-
97
-
98
-
99
-
100
-
101
-
102
-
103
-
104
-
105
-
106
-
107
-
108
-
109
-
110
-
111
-
112
-
113
-
114
-
115
-
116
-
117
-
118
-
119
-
120
-
121
-
122
-
123
-
124
-
125
-
126
-
127
-
128
-
129
-
130
-
131
-
132
-
133
-
134
-
135
-
136
-
137
-
138
-
139
-
140
-
141
-
142
-
143
-
144
-
145
 |
 |

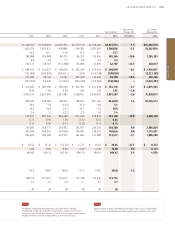
n n
Operating income (left scale)
Operating income margin (right scale)
Financial Data
0
2,000
6,000
4,000
2008 20102009 2011 2012
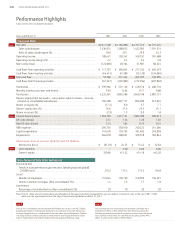
5,330.8
36.1
4,467.5
33.7
4,528.4
35.1
4,679.5
4,692.9
32.0 37.4
60
40
20
00
100
300
200
2008 20102009 2011 2012
204.9
3.8 105.3
2.4
132.5
2.9
94.3
68.7
1.5 2.0
9
6
3
0
0
400
300
200
100
2008 20102009 2011 2012
38.1 49.1
113.4
296.4
23.4
0
400
1,200
800
2008 20102009 2011 2012
948.2
24.8
841.0
821.2
27.2
798.6
748.9
23.2 24.7
60
40
20
0
28.6
0
1,000
5,000
3,000
2,000
4,000
2008 20102009 2011 2012
3,821.9
1.03
2,945.5
1.01
3,024.0
1.02
3,228.0
3,221.9
0.98 1.04
2.0
1.2
0.4
1.6
0.8
0
Net Sales and Ratio of
Sales Outside Japan
Operating Income and
Operating Income Margin
Free Cash FlowNet Income (Loss)
Owners’ Equity/
Owners’ Equity Ratio
Total Assets and
Monthly Inventory Turnover Rate
(¥ Billions) (%) (¥ Billions) (%)
(¥ Billions)(¥ Billions)
(¥ Billions) (%)(¥ Billions) (Times)
(Years ended March 31) (Years ended March 31)
(Years ended March 31)(Years ended March 31)
(As of March 31)(As of March 31)
n n
Net sales (left scale)
Ratio of sales outside Japan (right scale)
n n
Owners’ equity (left scale)
Owners’ equity ratio (right scale)
n n
Total assets (left scale)
Monthly inventory turnover rate (right scale)
–150
–100
0
–50
150
100
50
2008 20102009 2011 2012
48.1 42.7
55.0
93.0
–112.3
Net Sales
Net Income
Total Assets
Free Cash Flow
Operating Income
Owners’ Equity Ratio
–1.3%
–22.5%
–2.6%
–56.6%
–20.6%
+1.4Points
010 FUJITSU LIMITED ANNUAL REPORT 2012