Dollar Tree 2011 Annual Report Download - page 9
Download and view the complete annual report
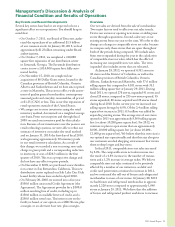
Please find page 9 of the 2011 Dollar Tree annual report below. You can navigate through the pages in the report by either clicking on the pages listed below, or by using the keyword search tool below to find specific information within the annual report.-
 1
1 -
 2
2 -
 3
3 -
 4
4 -
 5
5 -
 6
6 -
 7
7 -
 8
8 -
 9
9 -
 10
10 -
 11
11 -
 12
12 -
 13
13 -
 14
14 -
 15
15 -
 16
16 -
 17
17 -
 18
18 -
 19
19 -
 20
20 -
21
-
22
-
23
-
24
-
25
-
26
-
27
-
28
-
29
-
30
-
31
-
32
-
33
-
34
-
35
-
36
-
37
-
38
-
39
-
40
-
41
-
42
-
43
-
44
-
45
-
46
-
47
-
48
-
49
-
50
-
51
-
52
 |
 |

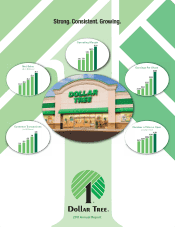
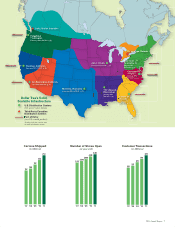
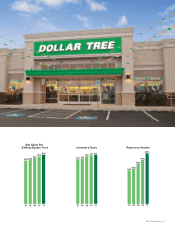
‘07 ‘08 ‘09 ‘10 ‘11
675
748
829
597
551
Customer Transactions
(in Millions)
‘07 ‘08 ‘09 ‘10 ‘11
192
222
254
165
152
Cartons Shipped
(in Millions)
‘07 ‘08 ‘09 ‘10 ‘11
3,806
4,101
4,351
3,591
3,411
Number of Stores Open
(at year-end)
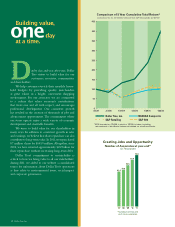
Stockton, California
January 2000 (525,000 sq. ft.)
Marietta, Oklahoma
February 2003 (603,000 sq. ft.)
San Bernardino, California
April 2010 (448,000 sq. ft.)
Ridgefield,
Washington
February 2004 (665,000 sq. ft.)
Delta, British Columbia
Mississauga, Ontario
Joliet, Illinois
June 2004 (1,200,000 sq. ft.)
Briar Creek,
Pennsylvania
August 2001
(1,003,000 sq. ft.)
Chesapeake,
Virginia
January 1998
(400,000 sq. ft. )
Savannah,
Georgia
February 2001
(1,014,000 sq. ft.)
Olive Branch,
Mississippi
January 1999
(425,000 sq. ft.)
U.S. Distribution Centers
Date opened (square footage)
Third-Party Canadian
Distribution Centers
Port of Entry
(non-U.S.-sourced products)
Shading indicates service area
for each distribution center.
Dollar Tree’s Solid,
Scalable Infrastructure
2011 Annual Report 7