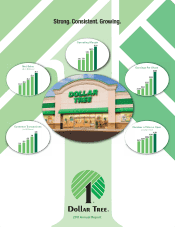
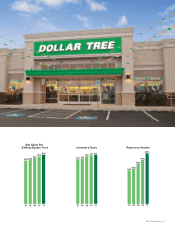
Dollar Tree 2011 Annual Report Download - page 3
Download and view the complete annual report
Please find page 3 of the 2011 Dollar Tree annual report below. You can navigate through the pages in the report by either clicking on the pages listed below, or by using the keyword search tool below to find specific information within the annual report.-
 1
1 -
 2
2 -
 3
3 -
 4
4 -
 5
5 -
 6
6 -
 7
7 -
 8
8 -
 9
9 -
 10
10 -
 11
11 -
 12
12 -
 13
13 -
 14
14 -
15
-
16
-
17
-
18
-
19
-
20
-
21
-
22
-
23
-
24
-
25
-
26
-
27
-
28
-
29
-
30
-
31
-
32
-
33
-
34
-
35
-
36
-
37
-
38
-
39
-
40
-
41
-
42
-
43
-
44
-
45
-
46
-
47
-
48
-
49
-
50
-
51
-
52
 |
 |
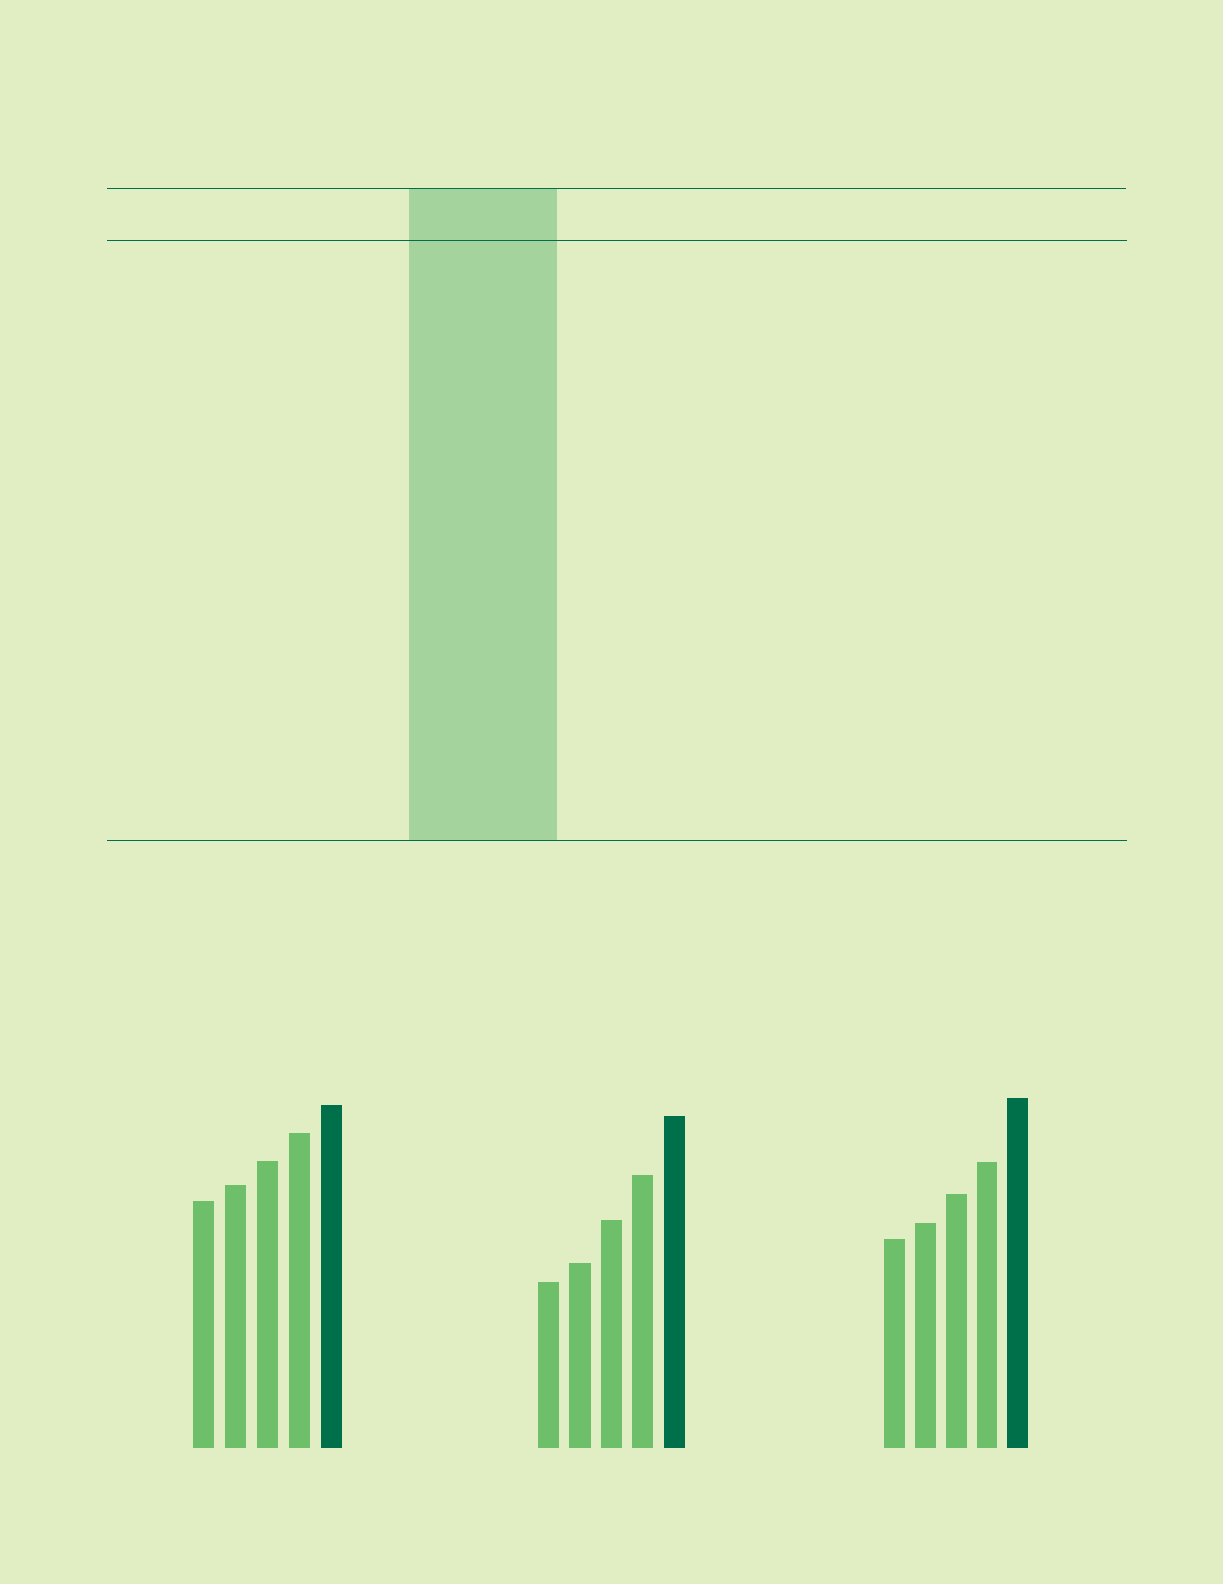
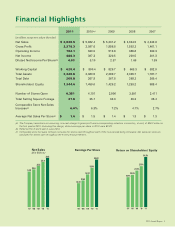
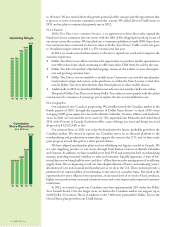
2011 2010(a) 2009 2008 2007
(in millions, except store and per share data)
Net Sales $ 6,630.5 $ 5,882.4 $ 5,231.2 $ 4,644.9 $ 4,242.6
Gross Profit 2,378.3 2,087.6 1,856.8 1,592.2 1,461.1
Operating Income 782.1 630.0 512.8 365.8 330.3
Net Income 488.3 397.3 320.5 229.5 201.3
Diluted Net Income Per Share(b) 4.03 3.10 2.37 1.69 1.39
Working Capital $ 628.4 $ 800.4 $ 829.7 $ 663.3 $ 382.9
Total Assets 2,328.6 2,380.5 2,289.7 2,035.7 1,787.7
Total Debt 265.8 267.8 267.8 268.2 269.4
Shareholders’ Equity 1,344.6 1,459.0 1,429.2 1,253.2 988.4
Number of Stores Open 4,351 4,101 3,806 3,591 3,411
Total Selling Square Footage 37.6 35.1 32.3 30.3 28.4
Comparable Store Net Sales
Increase(c) 6.0% 6.3% 7.2% 4.1% 2.7%
Average Net Sales Per Store(c) $ 1.6 $ 1.5 $ 1.4 $ 1.3 $ 1.3
(a) The Company recorded a non-recurring, non-cash charge to gross profit and a corresponding reduction in inventory, at cost, of $26.3 million in
the first quarter 2010. Excluding this charge, diluted earnings per share in 2010 were $3.23.
(b) Reflects 3 for 2 stock split in June 2010.
(c) Comparable store net sales compare net sales for stores open throughout each of the two periods being compared. Net sales per store are
calculated for stores open throughout the entire period presented.
‘07 ‘08 ‘09 ‘10 ‘11
$5.2
$5.9
$6.6
$4.6
$4.2
Net Sales
($ in Billions)
‘07 ‘08 ‘09 ‘10 ‘11
$2.37
$ 3.10
$4.03
$1.69
$1.39
Earnings Per Share
‘07 ‘08 ‘09 ‘10 ‘11
23.9%
27.5%
34.8%
20.5%
18.7%
Return on Shareholders’ Equity
Financial Highlights
2011 Annual Report 1