Dollar Tree 2011 Annual Report Download - page 37
Download and view the complete annual report
Please find page 37 of the 2011 Dollar Tree annual report below. You can navigate through the pages in the report by either clicking on the pages listed below, or by using the keyword search tool below to find specific information within the annual report.-
 1
1 -
2
-
3
-
4
-
5
-
6
-
7
-
8
-
9
-
10
-
11
-
12
-
13
-
14
-
15
-
16
-
17
-
18
-
19
-
20
-
21
-
22
-
23
-
24
-
25
-
26
-
 27
27 -
 28
28 -
 29
29 -
 30
30 -
 31
31 -
 32
32 -
 33
33 -
 34
34 -
 35
35 -
 36
36 -
 37
37 -
 38
38 -
 39
39 -
 40
40 -
 41
41 -
 42
42 -
 43
43 -
 44
44 -
 45
45 -
 46
46 -
 47
47 -
48
-
49
-
50
-
51
-
52
 |
 |

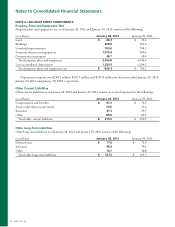
1RWHVWR&RQVROLGDWHG)LQDQFLDO6WDWHPHQWV
Lease Accounting
e Company leases most all of its retail locations under
operating leases. e Company recognizes minimum rent
expense starting when possession of the property is taken
from the landlord, which normally includes a construc-
tion period prior to store opening. When a lease contains
a predetermined fixed escalation of the minimum rent,
the Company recognizes the related rent expense on a
straight-line basis and records the difference between
the recognized rental expense and the amounts payable
under the lease as deferred rent. e Company also
receives tenant allowances, which are recorded in deferred
rent and are amortized as a reduction of rent expense
over the term of the lease.
Revenue Recognition
e Company recognizes sales revenue at the time a sale
is made to its customer.
Taxes Collected
e Company reports taxes assessed by a governmental
authority that are directly imposed on revenue-producing
transactions (i.e., sales tax) on a net (excluded from
revenues) basis.
Cost of Sales
e Company includes the cost of merchandise, ware-
housing and distribution costs, and certain occupancy
costs in cost of sales.
Pre-Opening Costs
e Company expenses pre-opening costs for new,
expanded and relocated stores, as incurred.
Advertising Costs
e Company expenses advertising costs as they are
incurred and they are included in “selling, general
and administrative expenses” on the accompanying
consolidated statements of operations. Advertising costs
approximated $13.8 million, $11.1 million and $8.3
million for the years ended January 28, 2012, January 29,
2011, and January 30, 2010, respectively.
Income Taxes
Income taxes are accounted for under the asset and
liability method. Deferred tax assets and liabilities are
recognized for the future tax consequences attributable to
differences between financial statement carrying amounts
of existing assets and liabilities and their respective tax
bases. Deferred tax assets and liabilities are measured
using enacted tax rates expected to apply to taxable
income in the years in which those temporary differences
are expected to be recovered or settled. e effect on
deferred tax assets and liabilities of a change in tax rates
is recognized in income in the period that includes the
enactment date of such change.
e Company includes interest and penalties in
the provision for income tax expense and income taxes
payable. e Company does not provide for any penalties
associated with tax contingencies unless they are consid-
ered probable of assessment.
Stock-Based Compensation
e Company recognizes all share-based payments to
employees, including grants of employee stock options, in
the financial statements based on their fair values. Total
stock-based compensation expense for 2011, 2010 and
2009 was $31.0 million, $27.9 million and $21.7 million,
respectively.
e Company recognizes expense related to the fair
value of stock options and restricted stock units (RSUs)
over the requisite service period on a straight-line basis or
a shorter period based on the retirement eligibility of the
grantee. e fair value of stock option grants is estimated
on the date of grant using the Black-Scholes option
pricing model. e fair value of the RSUs is determined
using the closing price of the Company’s common stock
on the date of grant.
Net Income Per Share
Basic net income per share has been computed by
dividing net income by the weighted average number
of shares outstanding. Diluted net income per share
reflects the potential dilution that could occur assuming
the inclusion of dilutive potential shares and has been
computed by dividing net income by the weighted
average number of shares and dilutive potential shares
outstanding. Dilutive potential shares include all
outstanding stock options and unvested RSUs after
applying the treasury stock method.
2011 Annual Report 35