Dollar Tree 2011 Annual Report Download - page 21
Download and view the complete annual report
Please find page 21 of the 2011 Dollar Tree annual report below. You can navigate through the pages in the report by either clicking on the pages listed below, or by using the keyword search tool below to find specific information within the annual report.-
 1
1 -
2
-
3
-
4
-
5
-
6
-
7
-
8
-
9
-
10
-
 11
11 -
 12
12 -
 13
13 -
 14
14 -
 15
15 -
 16
16 -
 17
17 -
 18
18 -
 19
19 -
 20
20 -
 21
21 -
 22
22 -
 23
23 -
 24
24 -
 25
25 -
 26
26 -
 27
27 -
 28
28 -
 29
29 -
 30
30 -
 31
31 -
32
-
33
-
34
-
35
-
36
-
37
-
38
-
39
-
40
-
41
-
42
-
43
-
44
-
45
-
46
-
47
-
48
-
49
-
50
-
51
-
52
 |
 |

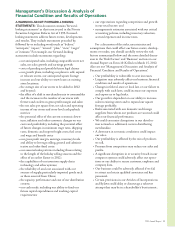
0DQDJHPHQW·V'LVFXVVLRQ$QDO\VLVRI
)LQDQFLDO&RQGLWLRQDQG5HVXOWVRI2SHUDWLRQV
Net cash used in investing activities increased $161.6
million in 2010 compared with 2009 primarily due to
short-term investment activity and the Dollar Giant
acquisition. In 2010 we purchased $157.8 million of
short-term investments compared to $27.8 million in
2009. is was partially offset by an increase in proceeds
from the sales of short-term investments of $10.8 million
in 2010.
In 2011, net cash used in financing activities
increased $218.9 million as a result of increased share
repurchases in 2011.
In 2010, net cash used in financing activities
increased $243.0 million as a result of increased share
repurchases in 2010 and payments of $13.8 million for
debt acquired from Dollar Giant.
At January 28, 2012, our long-term borrowings were
$265.5 million and our capital lease commitments were
$0.3 million. We also have $110.0 million and $75.0
million Letter of Credit Reimbursement and Security
Agreements, under which approximately $139.5 million
were committed to letters of credit issued for routine
purchases of imported merchandise at January 28, 2012.
In February 2008, we entered into a five-year $550.0
million unsecured Credit Agreement (the Agreement).
Net cash provided by operating activities increased
$167.8 million in 2011 compared to 2010 due to
increased earnings before income taxes, depreciation and
amortization in the current year, a decrease in cash used
to purchase merchandise inventories and an increase
in other current liabilities due to increases in sales tax
collected and accrued expenses.
Net cash provided by operating activities decreased
$62.3 million in 2010 compared to 2009 due to an
increase in cash used to purchase merchandise invento-
ries partially offset by increased earnings before income
taxes, depreciation and amortization in the current year.
Net cash used in investing activities decreased
$288.0 million in 2011 primarily due to an additional
$170.0 million of proceeds from the sale of short-term
investments with minimal purchases of short-term
investments compared to $157.8 million of purchases
in 2010. e proceeds were used to fund the share
repurchases in 2011. In addition, in 2010 we used $49.4
million to acquire Dollar Giant. ese increased sources
of cash were partially offset by a $71.4 million increase in
capital expenditures in 2011 due to funds for new store
projects and the expansion of our distribution center in
Savannah, Georgia.
Liquidity and Capital Resources
Our business requires capital to build and open new stores, expand our distribution network and operate and expand
existing stores. Our working capital requirements for existing stores are seasonal and usually reach their peak in
September and October. Historically, we have satisfied our seasonal working capital requirements for existing stores
and have funded our store opening and distribution network expansion programs from internally generated funds and
borrowings under our credit facilities.
e following table compares cash-flow related information for the years ended January 28, 2012, January 29, 2011
and January 30, 2010:
Year Ended
(in millions) January 28, 2012 January 29, 2011 January 30, 2010
Net cash provided by (used in):
Operating activities $ 686.5 $ 518.7 $ 581.0
Investing activities (86.1) (374.1) (212.5)
Financing activities (623.2) (404.3) (161.3)
2011 Annual Report 19