Dollar Tree 2011 Annual Report Download - page 48
Download and view the complete annual report
Please find page 48 of the 2011 Dollar Tree annual report below. You can navigate through the pages in the report by either clicking on the pages listed below, or by using the keyword search tool below to find specific information within the annual report.-
 1
1 -
2
-
3
-
4
-
5
-
6
-
7
-
8
-
9
-
10
-
11
-
12
-
13
-
14
-
15
-
16
-
17
-
18
-
19
-
20
-
21
-
22
-
23
-
24
-
25
-
26
-
27
-
28
-
29
-
30
-
31
-
32
-
33
-
34
-
35
-
36
-
37
-
 38
38 -
 39
39 -
 40
40 -
 41
41 -
 42
42 -
 43
43 -
 44
44 -
 45
45 -
 46
46 -
 47
47 -
 48
48 -
 49
49 -
 50
50 -
 51
51 -
 52
52
 |
 |

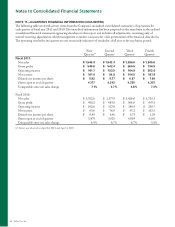
1RWHVWR&RQVROLGDWHG)LQDQFLDO6WDWHPHQWV
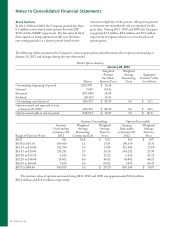
e following tables summarize the Company’s various option plans and information about options outstanding at
January 28, 2012 and changes during the year then ended.
Stock Option Activity
January 28, 2012
Shares
Weighted
Average
Per Share
Exercise Price
Weighted
Average
Remaining
Term
Aggregate
Intrinsic Value
(in millions)
Outstanding, beginning of period 1,022,071 $ 19.16
Granted 7,639 69.41
Exercised (355,640) 18.40
Forfeited (18,517) 14.31
Outstanding, end of period 655,553 $ 20.29 3.6 $ 13.3
Options vested and expected to vest
at January 28, 2012 655,553 $ 20.29 3.6 $ 13.3
Options exercisable at end of period 630,554 $ 19.97 3.5 $ 40.8
Options Outstanding Options Exercisable
Range of Exercise Prices
Options
Outstanding
at January 28,
2012
Weighted
Average
Remaining
Contractual Life
Weighted
Average
Exercise
Price
Options
Exercisable
at January 28,
2012
Weighted
Average
Exercise
Price
$0.57 921 N/A $ 0.57 921 $ 0.57
$0.58 to $14.18 100,419 1.1 13.35 100,419 13.35
$14.19 to $19.86 311,356 3.8 17.50 311,356 17.50
$19.87 to $29.04 219,231 3.7 24.26 194,232 23.70
$29.05 to $32.24 5,525 7.8 32.22 5,525 32.22
$32.25 to $56.08 10,462 8.6 46.52 10,462 46.52
$56.09 to $84.64 7,639 9.5 69.41 7,639 69.41
$0.57 to $84.64 655,553 3.6 $ 20.29 630,554 $ 19.97
e intrinsic value of options exercised during 2011, 2010 and 2009 was approximately $16.4 million,
$16.0 million and $11.0 million, respectively.
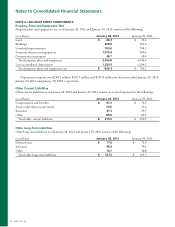
Stock Options
In 2011, 2010 and 2009, the Company granted less than
0.1 million service based stock options from the EIP,
EOP and the NEDP, respectively. e fair value of all of
these options is being expensed ratably over the three-
year vesting periods, or a shorter period based on the
retirement eligibility of the grantee. All options granted
to directors vest immediately and are expensed on the
grant date. During 2011, 2010 and 2009, the Company
recognized $1.1 million, $2.3 million and $3.7 million,
respectively of expense related to service-based stock
option grants.
46 Dollar Tree, Inc.