Dollar Tree 2011 Annual Report Download - page 19
Download and view the complete annual report
Please find page 19 of the 2011 Dollar Tree annual report below. You can navigate through the pages in the report by either clicking on the pages listed below, or by using the keyword search tool below to find specific information within the annual report.-
 1
1 -
2
-
3
-
4
-
5
-
6
-
7
-
8
-
 9
9 -
 10
10 -
 11
11 -
 12
12 -
 13
13 -
 14
14 -
 15
15 -
 16
16 -
 17
17 -
 18
18 -
 19
19 -
 20
20 -
 21
21 -
 22
22 -
 23
23 -
 24
24 -
 25
25 -
 26
26 -
 27
27 -
 28
28 -
 29
29 -
30
-
31
-
32
-
33
-
34
-
35
-
36
-
37
-
38
-
39
-
40
-
41
-
42
-
43
-
44
-
45
-
46
-
47
-
48
-
49
-
50
-
51
-
52
 |
 |

0DQDJHPHQW·V'LVFXVVLRQ$QDO\VLVRI
)LQDQFLDO&RQGLWLRQDQG5HVXOWVRI2SHUDWLRQV
Fiscal year ended January 28, 2012 compared to
fiscal year ended January 29, 2011
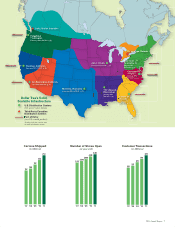
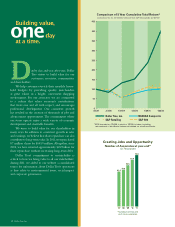
Net Sales. Net sales increased 12.7%, or $748.0 million,
in 2011 compared to 2010, resulting from sales in our new
stores and a 6.0% increase in comparable store net sales.
Comparable store net sales are positively affected by our
expanded and relocated stores, which we include in the
calculation, and, to a lesser extent, are negatively affected
when we open new stores or expand stores near existing ones.
e following table summarizes the components
of the changes in our store count for fiscal years ended
January 28, 2012 and January 29, 2011.
January 28,
2012
January 29,
2011
New stores 278 235
Acquired stores — 86
Expanded or
relocated stores 91 95
Closed stores (28) (26)
Of the 2.4 million selling square foot increase in
2011 approximately 0.3 million was added by expanding
existing stores.
• Gross profit margin was 35.9% in 2011 compared
to 35.5% in 2010. Excluding the effect of the $26.3
million non-cash beginning inventory adjustment,
gross profit margin remained at 35.9%. Improvement
in initial mark-up in many categories and occupancy
and distribution cost leverage were offset by an
increase in the mix of higher cost consumer product
merchandise and a smaller reduction in the shrink
accrual rate in fiscal 2011 than in fiscal 2010.
Selling, General and Administrative Expenses. Selling,
general and administrative expenses, as a percentage
of net sales, decreased to 24.1% for 2011 compared to
24.8% for 2010. e decrease is primarily due to the
following:
• Payroll expenses decreased 45 basis points due to
leveraging associated with the increase in comparable
store net sales in the current year, lower store
hourly payroll and lower incentive compensation
achievement.
• Depreciation decreased 25 basis points primarily
due to the leveraging associated with the increase in
comparable store net sales in the current year.
Operating Income. Operating income margin was 11.8%
in 2011 compared to 10.7% in 2010. Excluding the $26.3
million non-cash adjustment to beginning inventory,
operating income margin was 11.1% in 2010. Due to the
reasons noted above, operating income margin excluding
this charge, improved 70 basis points.
Income Taxes. Our effective tax rate was 37.4% in 2011
and 36.9% in 2010.
2011 Annual Report 17