Dollar Tree 2011 Annual Report Download - page 17
Download and view the complete annual report
Please find page 17 of the 2011 Dollar Tree annual report below. You can navigate through the pages in the report by either clicking on the pages listed below, or by using the keyword search tool below to find specific information within the annual report.-
 1
1 -
2
-
3
-
4
-
5
-
6
-
 7
7 -
 8
8 -
 9
9 -
 10
10 -
 11
11 -
 12
12 -
 13
13 -
 14
14 -
 15
15 -
 16
16 -
 17
17 -
 18
18 -
 19
19 -
 20
20 -
 21
21 -
 22
22 -
 23
23 -
 24
24 -
 25
25 -
 26
26 -
 27
27 -
28
-
29
-
30
-
31
-
32
-
33
-
34
-
35
-
36
-
37
-
38
-
39
-
40
-
41
-
42
-
43
-
44
-
45
-
46
-
47
-
48
-
49
-
50
-
51
-
52
 |
 |

0DQDJHPHQW·V'LVFXVVLRQ$QDO\VLVRI
)LQDQFLDO&RQGLWLRQDQG5HVXOWVRI2SHUDWLRQV
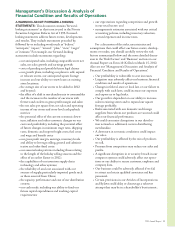
Overview
Our net sales are derived from the sale of merchandise.
Two major factors tend to affect our net sales trends.
First is our success at opening new stores or adding new
stores through acquisitions. Second, sales vary at our
existing stores from one year to the next. We refer to this
change as a change in comparable store net sales, because
we compare only those stores that are open throughout
both of the periods being compared. We include sales
from stores expanded during the year in the calculation
of comparable store net sales, which has the effect of
increasing our comparable store net sales. e term
‘expanded’ also includes stores that are relocated.
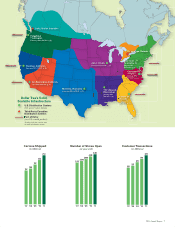
At January 28, 2012, we operated 4,351 stores in
48 states and the District of Columbia, as well as the
Canadian provinces of British Columbia, Ontario,
Alberta, Saskatchewan and Manitoba, with 37.6 million
selling square feet compared to 4,101 stores with 35.1
million selling square feet at January 29, 2011. During
fiscal 2011, we opened 278 stores, expanded 91 stores and
closed 28 stores, compared to 235 new stores opened, 95
stores expanded, 86 stores acquired and 26 stores closed
during fiscal 2010. In the current year we increased our
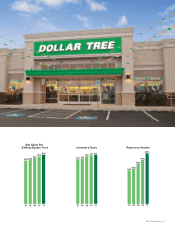
selling square footage by 6.9%. Of the 2.4 million selling
square foot increase in 2011, 0.3 million was added by
expanding existing stores. e average size of our stores
opened in 2011 was approximately 8,360 selling square
feet (or about 10,280 gross square feet). For 2012, we
continue to plan to open stores that are approximately
8,000–10,000 selling square feet (or about 10,000–
12,000 gross square feet). We believe that this store size is
our optimal size operationally and that this size also gives
our customers an ideal shopping environment that invites
them to shop longer and buy more.
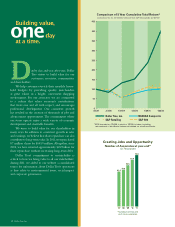
In fiscal 2011, comparable store net sales increased
by 6.0%. e comparable store net sales increase was
the result of a 4.8% increase in the number of transac-
tions and a 1.2% increase in average ticket. We believe
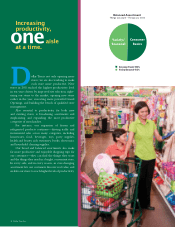
comparable store net sales continued to be positively
affected by a number of our initiatives, as debit and
credit card penetration continued to increase in 2011,
and we continued the roll-out of frozen and refrigerated
merchandise to more of our stores. At January 28, 2012
we had frozen and refrigerated merchandise in approxi-
mately 2,220 stores compared to approximately 1,840
stores at January 29, 2011. We believe that the addition
of frozen and refrigerated product enables us to increase
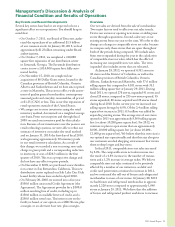
Key Events and Recent Developments
Several key events have had or are expected to have a
significant effect on our operations. You should keep in
mind that:
• On October 7, 2011, our Board of Directors autho-
rized the repurchase of an additional $1.5 billion
of our common stock. At January 28, 2012, we had
approximately $1.2 billion remaining under Board
authorizations.
• On October 7, 2011, we completed a 410,000
square foot expansion of our distribution center
in Savannah, Georgia. e Savannah distribution
center is now a 1,014,000 square foot, fully auto-
mated facility.
• On November 15, 2010, we completed our
acquisition of 86 Dollar Giant stores, located in the
Canadian provinces of British Columbia, Ontario,
Alberta and Saskatchewan and we have since opened
a store in Manitoba. ese stores offer a wide assort-
ment of quality general merchandise, contemporary
seasonal goods and everyday consumables, all priced
at $1.25 (CAD) or less. is is our first expansion of
retail operations outside of the United States.
• We assign cost to store inventories using the retail
inventory method, determined on a weighted average
cost basis. From our inception and through fiscal
2009, we used one inventory pool for this calcula-
tion. Because of our investments over the years in our
retail technology systems, we were able to refine our
estimate of inventory cost under the retail method
and on January 31, 2010, the first day of fiscal 2010,
we began using approximately 30 inventory pools
in our retail inventory calculation. As a result of
this change, we recorded a non-recurring, non-cash
charge to gross profit and a corresponding reduction
in inventory, at cost, of $26.3 million in the first
quarter of 2010. is was a prospective change and
did not have any effect on prior periods.
• On November 2, 2009, we purchased a new distribu-
tion center in San Bernardino, California. is new
distribution center replaced our Salt Lake City, Utah
leased facility whose lease ended in April 2010.
• On February 20, 2008, we entered into a five-year
$550.0 million unsecured Credit Agreement (the
Agreement). e Agreement provides for a $300.0
million revolving line of credit, including up to
$150.0 million in available letters of credit, and a
$250.0 million term loan. e interest rate on the
facility is based, at our option, on a LIBOR rate, plus
a margin, or an alternate base rate, plus a margin.
2011 Annual Report 15