Cash America 2009 Annual Report Download - page 20
Download and view the complete annual report
Please find page 20 of the 2009 Cash America annual report below. You can navigate through the pages in the report by either clicking on the pages listed below, or by using the keyword search tool below to find specific information within the annual report.-
 1
1 -
2
-
3
-
4
-
5
-
6
-
7
-
8
-
9
-
 10
10 -
 11
11 -
 12
12 -
 13
13 -
 14
14 -
 15
15 -
 16
16 -
 17
17 -
 18
18 -
 19
19 -
 20
20 -
 21
21 -
 22
22 -
 23
23 -
 24
24 -
 25
25 -
 26
26 -
 27
27 -
 28
28 -
 29
29 -
 30
30 -
31
-
32
-
33
-
34
-
35
-
36
-
37
-
38
-
39
-
40
-
41
-
42
-
43
-
44
-
45
-
46
-
47
-
48
-
49
-
50
-
51
-
52
-
53
-
54
-
55
-
56
-
57
-
58
-
59
-
60
-
61
-
62
-
63
-
64
-
65
-
66
-
67
-
68
-
69
-
70
-
71
-
72
-
73
-
74
-
75
-
76
-
77
-
78
-
79
-
80
-
81
-
82
-
83
-
84
-
85
-
86
-
87
-
88
-
89
-
90
-
91
-
92
-
93
-
94
-
95
-
96
-
97
-
98
-
99
-
100
-
101
-
102
-
103
-
104
-
105
-
106
-
107
-
108
-
109
-
110
-
111
-
112
-
113
-
114
-
115
-
116
-
117
-
118
-
119
-
120
-
121
-
122
-
123
-
124
-
125
-
126
-
127
-
128
-
129
-
130
-
131
-
132
-
133
-
134
-
135
-
136
-
137
-
138
-
139
-
140
-
141
-
142
-
143
-
144
-
145
-
146
-
147
-
148
-
149
-
150
-
151
-
152
-
153
-
154
-
155
-
156
-
157
-
158
-
159
-
160
-
161
-
162
-
163
-
164
-
165
-
166
-
167
-
168
-
169
-
170
-
171
-
172
-
173
-
174
-
175
-
176
-
177
-
178
 |
 |

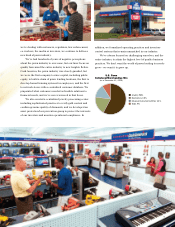
Storefront and Internet Lending
Internet Lending Only
Storefront Lending Only
No Lending Activity
Legend for Geographic
Market Presence
United
Kingdom
Australia
Ontario
Alaska
Hawaii
Mexico
British
Columbia
Cash America Pawn, SuperPawn, Prenda Fácil, CashNetUSA, Quick Quid, Dollars Direct, Cashland and
Cash America Payday Advance locations and market coverage as of December 31.
Cash America Market Coverage
Lending Locations
As of December 31
U.S. PAWN 2009 2008 2007
Texas ......................... 200 200 199
Florida ........................ 70 69 68
Nevada ....................... 28 26 27
Tennessee .................. 22 22 22
Louisiana .................... 21 20 20
Arizona ....................... 18 18 18
Georgia ...................... 17 17 17
Missouri ...................... 17 17 17
Oklahoma ................... 15 15 15
Illinois ......................... 14 19 18
Indiana ....................... 13 13 13
Kentucky..................... 10 10 10
North Carolina ............. 10 10 10
Alabama ..................... 9 9 9
Utah ........................... 7 7 7
Ohio ........................... 6 6 6
South Carolina ............ 6 6 6
Alaska ........................ 5 5 5
Colorado ..................... 5 5 5
Washington ................. 5 5 5
California .................... 1 1 1
Nebraska .................... 1 1 1
Total U.S. Pawn 500 501 499
CASH ADVANCE 2009 2008 2007
Ohio ............................ 114 114 139
Texas ........................... 50 51 54
Indiana ........................ 31 32 32
California ..................... 23 23 33
Kentucky...................... 16 16 16
Michigan ...................... 12 12 12
Illinois .......................... – – 18
Total Cash Advance 246 248 304
TOTAL LENDING
LOCATIONS 922 861 803
16
Cash America International, Inc.
MEXICO PAWN 2009 2008 2007
Guerrero ....................... 22 14 –
Estado de Mexico .......... 21 16 –
Distrito Federal .............. 20 13 –
Veracruz ....................... 19 11 –
Oaxaca ......................... 14 10 –
Chiapas ........................ 12 8 –
Jalisco .......................... 12 8 –
Tabasco ........................ 12 11 –
Guanajuato ................... 9 6 –
Michoacan .................... 9 2 –
Puebla .......................... 6 4 –
Other States ................. 20 9 –
Total Mexico Pawn 176 112 –