XM Radio 2014 Annual Report Download - page 93
Download and view the complete annual report
Please find page 93 of the 2014 XM Radio annual report below. You can navigate through the pages in the report by either clicking on the pages listed below, or by using the keyword search tool below to find specific information within the annual report.-
 1
1 -
2
-
3
-
4
-
5
-
6
-
7
-
8
-
9
-
10
-
11
-
12
-
13
-
14
-
15
-
16
-
17
-
18
-
19
-
20
-
21
-
22
-
23
-
24
-
25
-
26
-
27
-
28
-
29
-
30
-
31
-
32
-
33
-
34
-
35
-
36
-
37
-
38
-
39
-
40
-
41
-
42
-
43
-
44
-
45
-
46
-
47
-
48
-
49
-
50
-
51
-
52
-
53
-
54
-
55
-
56
-
57
-
58
-
59
-
60
-
61
-
62
-
63
-
64
-
65
-
66
-
67
-
68
-
69
-
70
-
71
-
72
-
73
-
74
-
75
-
76
-
77
-
78
-
79
-
80
-
81
-
82
-
 83
83 -
 84
84 -
 85
85 -
 86
86 -
 87
87 -
 88
88 -
 89
89 -
 90
90 -
 91
91 -
 92
92 -
 93
93 -
 94
94 -
 95
95 -
 96
96 -
 97
97 -
 98
98 -
 99
99 -
 100
100 -
 101
101 -
 102
102 -
 103
103 -
104
-
105
-
106
-
107
-
108
-
109
-
110
-
111
-
112
-
113
-
114
-
115
-
116
-
117
-
118
-
119
-
120
-
121
-
122
-
123
-
124
-
125
-
126
-
127
-
128
-
129
-
130
-
131
-
132
-
133
-
134
-
135
-
136
-
137
-
138
-
139
-
140
-
141
-
142
-
143
-
144
-
145
-
146
-
147
-
148
-
149
 |
 |
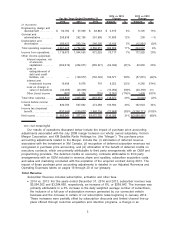
New Vehicle Consumer Conversion Rate is the percentage of owners and lessees of new
vehicles that receive our service and convert to become self-paying subscribers after an initial
promotional period. The metric excludes rental and fleet vehicles. (See accompanying glossary on
pages 18 through 22 for more details).
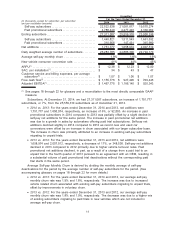
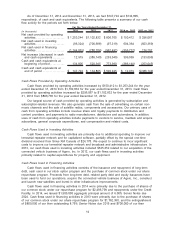
•2014 vs. 2013: For the years ended December 31, 2014 and 2013, the new vehicle
consumer conversion rate was 41% and 44%, respectively. The decrease in the new vehicle
consumer conversion rate was primarily due to an increased penetration rate and lower
conversion of first-time satellite enabled car buyers and lessees.
•2013 vs. 2012: For the years ended December 31, 2013 and 2012, the new vehicle
consumer conversion rate was 44% and 45%, respectively. The decrease in the new vehicle
consumer conversion rate was primarily due to the mix of sales by OEMs.
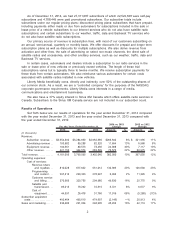
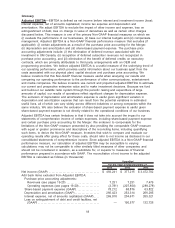
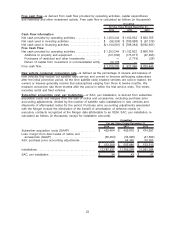
ARPU is derived from total earned subscriber revenue (excluding revenue derived from our
connected vehicle services business), net advertising revenue and other subscription-related
revenue, net of purchase price accounting adjustments, divided by the number of months in the
period, divided by the daily weighted average number of subscribers for the period. (For a
reconciliation to GAAP see the accompanying glossary on pages 18 through 22 for more details.)
•2014 vs. 2013: For the years ended December 31, 2014 and 2013, ARPU was $12.38 and
$12.23, respectively. The increase was driven primarily by the contribution of the U.S. Music
Royalty Fee, and the impact of the increase in certain of our subscription rates beginning in
January 2014. The positive result was partially offset by growth in subscription discounts and
limited channel line-up plans offered through our customer acquisition and retention
programs, lifetime subscription plans that have reached full revenue recognition and changes
in contracts with an automaker and a rental car company.
•2013 vs. 2012: For the years ended December 31, 2013 and 2012, ARPU was $12.23 and
$12.00, respectively. The increase was driven primarily by the contribution of the U.S. Music
Royalty Fee, the impact of the increase in certain of our subscription rates beginning in
January 2012, and an increase in subscriptions to premium services, partially offset by
subscription discounts offered through customer acquisition and retention programs, and
lifetime subscription plans that have reached full revenue recognition.
SAC, Per Installation, is derived from subscriber acquisition costs and margins from the sale of
radios, components and accessories, excluding purchase price accounting adjustments, divided by
the number of satellite radio installations in new vehicles and shipments of aftermarket radios for
the period. (For a reconciliation to GAAP see the accompanying glossary on pages 18 through 22
for more details.)
•2014 vs. 2013: For the years ended December 31, 2014 and 2013, SAC, per installation,
was $34 and $43, respectively. The decrease was primarily due to improvements in
contractual OEM rates.
•2013 vs. 2012: For the years ended December 31, 2013 and 2012, SAC, per installation,
was $43 and $47, respectively. The decrease was primarily due to lower subsidies per
vehicle.
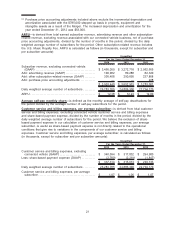
Customer Service and Billing Expenses, Per Average Subscriber, is derived from total customer
service and billing expenses, excluding connected vehicle customer service and billing expenses
and share-based payment expense, divided by the number of months in the period, divided by the
daily weighted average number of subscribers for the period. (For a reconciliation to GAAP see the
accompanying glossary on pages 18 through 22 for more details.)
•2014 vs. 2013: For the years ended December 31, 2014 and 2013, customer service and
billing expenses, per average subscriber, were $1.07 and $1.06, respectively. The increase
was primarily driven by increased bad debt expense.
•2013 vs. 2012: For the years ended December 31, 2013 and 2012, customer service and
billing expenses, per average subscriber, were $1.06 and $1.07, respectively. The decrease
12