XM Radio 2014 Annual Report Download - page 86
Download and view the complete annual report
Please find page 86 of the 2014 XM Radio annual report below. You can navigate through the pages in the report by either clicking on the pages listed below, or by using the keyword search tool below to find specific information within the annual report.-
 1
1 -
2
-
3
-
4
-
5
-
6
-
7
-
8
-
9
-
10
-
11
-
12
-
13
-
14
-
15
-
16
-
17
-
18
-
19
-
20
-
21
-
22
-
23
-
24
-
25
-
26
-
27
-
28
-
29
-
30
-
31
-
32
-
33
-
34
-
35
-
36
-
37
-
38
-
39
-
40
-
41
-
42
-
43
-
44
-
45
-
46
-
47
-
48
-
49
-
50
-
51
-
52
-
53
-
54
-
55
-
56
-
57
-
58
-
59
-
60
-
61
-
62
-
63
-
64
-
65
-
66
-
67
-
68
-
69
-
70
-
71
-
72
-
73
-
74
-
75
-
 76
76 -
 77
77 -
 78
78 -
 79
79 -
 80
80 -
 81
81 -
 82
82 -
 83
83 -
 84
84 -
 85
85 -
 86
86 -
 87
87 -
 88
88 -
 89
89 -
 90
90 -
 91
91 -
 92
92 -
 93
93 -
 94
94 -
 95
95 -
 96
96 -
97
-
98
-
99
-
100
-
101
-
102
-
103
-
104
-
105
-
106
-
107
-
108
-
109
-
110
-
111
-
112
-
113
-
114
-
115
-
116
-
117
-
118
-
119
-
120
-
121
-
122
-
123
-
124
-
125
-
126
-
127
-
128
-
129
-
130
-
131
-
132
-
133
-
134
-
135
-
136
-
137
-
138
-
139
-
140
-
141
-
142
-
143
-
144
-
145
-
146
-
147
-
148
-
149
 |
 |
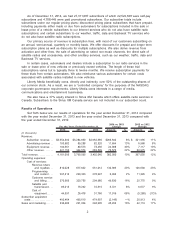
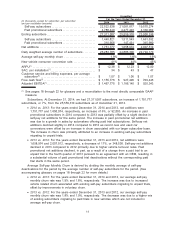
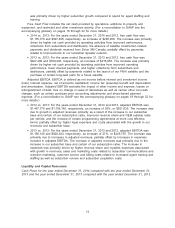
Operating Expenses
Revenue Share and Royalties include distribution and content provider revenue share, royalties
for broadcasting performance content and web streaming, and advertising revenue share.
•2014 vs. 2013: For the years ended December 31, 2014 and 2013, revenue share and
royalties were $810,028 and $677,642, respectively, an increase of 20%, or $132,386, and
increased as a percentage of total revenue. The increase was primarily attributable to the
elimination of the benefit to earnings from the amortization of deferred credits on executory
contracts initially recognized in purchase price accounting associated with the Merger, greater
revenues subject to royalty and/or revenue sharing arrangements, and a 5.6% increase in the
statutory royalty rate for the performance of sound recordings. For the year ended December
31, 2013, revenue share and royalties was positively impacted by a benefit of $122,534 to
earnings from the amortization of deferred credits on executory contracts associated with the
Merger.
•2013 vs. 2012: For the years ended December 31, 2013 and 2012, revenue share and
royalties were $677,642 and $551,012, respectively, an increase of 23%, or $126,630, and
increased as a percentage of total revenue. The increase was primarily attributable to greater
revenues subject to royalty and/or revenue sharing arrangements and a 12.5% increase in
the statutory royalty rate for the performance of sound recordings as well as a decrease in
the benefit to earnings from the amortization of deferred credits on executory contracts
initially recognized in purchase price accounting associated with the Merger.
We expect our revenue share and royalty costs to increase as our revenues grow and our
royalty rates increase. As determined by the Copyright Royalty Board’s decision, we paid royalties
of 9.5%, 9.0% and 8.0% of gross revenues, subject to certain exclusions, for the years ended
December 31, 2014, 2013 and 2012, respectively, and will pay 10.0% in 2015.
Programming and Content includes costs to acquire, create, promote and produce content. We
have entered into various agreements with third parties for music and non-music programming that
require us to pay license fees and other amounts.
•2014 vs. 2013: For the years ended December 31, 2014 and 2013, programming and content
expenses were $297,313 and $290,323, respectively, an increase of 2%, or $6,990, but
decreased as a percentage of total revenue. The increase was primarily due to higher
personnel costs, the reduction in the benefit to earnings from the purchase price accounting
adjustments associated with the Merger and the early termination of certain agreements,
partially offset by the renewal of certain licensing agreements at more cost effective terms.
•2013 vs. 2012: For the years ended December 31, 2013 and 2012, programming and content
expenses were $290,323 and $278,997, respectively, an increase of 4%, or $11,326, but
decreased as a percentage of total revenue. The increase was primarily due to reductions in
the benefit to earnings from purchase price accounting adjustments associated with the
Merger attributable to the amortization of the deferred credit on acquired programming
executory contracts and increased personnel costs.
We expect our programming and content expenses to fluctuate as we offer additional
programming, and renew or replace expiring agreements.
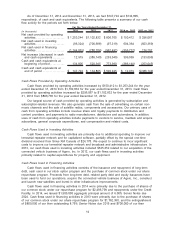
Customer Service and Billing includes costs associated with the operation and management of
internal and third party customer service centers, and our subscriber management systems as well
as billing and collection costs, transaction fees and bad debt expense.
•2014 vs. 2013: For the years ended December 31, 2014 and 2013, customer service and
billing expenses were $370,585 and $320,755, respectively, an increase of 16%, or $49,830,
and increased as a percentage of total revenue. The increase was primarily due to the
inclusion of a full year of costs associated with our connected vehicle services business,
higher subscriber volume driving increased subscriber contacts and increased bad debt
expense.
•2013 vs. 2012: For the years ended December 31, 2013 and 2012, customer service and
billing expenses were $320,755 and $294,980, respectively, an increase of 9%, or $25,775,
5