XM Radio 2014 Annual Report Download - page 85
Download and view the complete annual report
Please find page 85 of the 2014 XM Radio annual report below. You can navigate through the pages in the report by either clicking on the pages listed below, or by using the keyword search tool below to find specific information within the annual report.-
 1
1 -
2
-
3
-
4
-
5
-
6
-
7
-
8
-
9
-
10
-
11
-
12
-
13
-
14
-
15
-
16
-
17
-
18
-
19
-
20
-
21
-
22
-
23
-
24
-
25
-
26
-
27
-
28
-
29
-
30
-
31
-
32
-
33
-
34
-
35
-
36
-
37
-
38
-
39
-
40
-
41
-
42
-
43
-
44
-
45
-
46
-
47
-
48
-
49
-
50
-
51
-
52
-
53
-
54
-
55
-
56
-
57
-
58
-
59
-
60
-
61
-
62
-
63
-
64
-
65
-
66
-
67
-
68
-
69
-
70
-
71
-
72
-
73
-
74
-
 75
75 -
 76
76 -
 77
77 -
 78
78 -
 79
79 -
 80
80 -
 81
81 -
 82
82 -
 83
83 -
 84
84 -
 85
85 -
 86
86 -
 87
87 -
 88
88 -
 89
89 -
 90
90 -
 91
91 -
 92
92 -
 93
93 -
 94
94 -
 95
95 -
96
-
97
-
98
-
99
-
100
-
101
-
102
-
103
-
104
-
105
-
106
-
107
-
108
-
109
-
110
-
111
-
112
-
113
-
114
-
115
-
116
-
117
-
118
-
119
-
120
-
121
-
122
-
123
-
124
-
125
-
126
-
127
-
128
-
129
-
130
-
131
-
132
-
133
-
134
-
135
-
136
-
137
-
138
-
139
-
140
-
141
-
142
-
143
-
144
-
145
-
146
-
147
-
148
-
149
 |
 |
agreement with an automaker and a rental car company, and an increasing number of
lifetime subscription plans that have reached full revenue recognition.
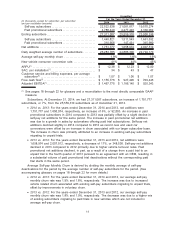
•2013 vs. 2012: For the years ended December 31, 2013 and 2012, subscriber revenue was
$3,284,660 and $2,962,665, respectively, an increase of 11%, or $321,995. The increase was
primarily attributable to a 9% increase in the daily weighted average number of subscribers,
the impact of the increase in certain of our subscription rates beginning in January 2012 as
more subscribers migrated to the higher rates, and an increase in subscriptions to premium
services, premier channels and Internet streaming, as well as the inclusion of connected
vehicle subscription revenue in 2013. These increases were partially offset by subscription
discounts offered through customer acquisition and retention programs, and an increasing
number of lifetime subscription plans that have reached full revenue recognition.
We expect subscriber revenues to increase based on the growth of our subscriber base,
including connected vehicle subscribers, changes in our subscription rates and the sale of additional
services to subscribers.
Advertising Revenue includes the sale of advertising on certain non-music channels.
•2014 vs. 2013: For the years ended December 31, 2014 and 2013, advertising revenue was
$100,982 and $89,288, respectively, an increase of 13%, or $11,694. The increase was
primarily due to a greater number of advertising spots sold and broadcast, as well as
increases in rates charged per spot.
•2013 vs. 2012: For the years ended December 31, 2013 and 2012, advertising revenue was
$89,288 and $82,320, respectively, an increase of 8%, or $6,968. The increase was primarily
due to a greater number of advertising spots sold and broadcast, as well as increases in
rates charged per spot.
We expect our advertising revenue to grow as more advertisers are attracted to our national
platform and growing subscriber base and as we launch additional non-music channels.
Equipment Revenue includes revenue and royalties from the sale of satellite radios,
components and accessories.
•2014 vs. 2013: For the years ended December 31, 2014 and 2013, equipment revenue was
$104,661 and $80,573, respectively, an increase of 30%, or $24,088. The increase was
driven by higher sales to distributors and royalties from OEM production, partially offset by
lower per unit revenue on direct to consumer sales.
•2013 vs. 2012: For the years ended December 31, 2013 and 2012, equipment revenue was
$80,573 and $73,456, respectively, an increase of 10%, or $7,117. The increase was driven
by royalties from higher OEM production, the mix of royalty eligible radios and, to a lesser
extent, improved aftermarket subsidies.
We expect equipment revenue to fluctuate based on OEM production for which we receive
royalty payments for our technology and, to a lesser extent, on the volume of equipment sales in
our aftermarket and direct to consumer business.
Other Revenue includes amounts earned from subscribers for the U.S. Music Royalty Fee,
revenue from our Canadian affiliate and ancillary revenues.
•2014 vs. 2013: For the years ended December 31, 2014 and 2013, other revenue was
$421,150 and $344,574, respectively, an increase of 22%, or $76,576. The increase was
driven by revenues from the U.S. Music Royalty Fee as the number of subscribers subject to
the 12.5% rate increased along with an overall increase in subscribers, by a change in an
agreement with a rental car company and the inclusion of a full year of other revenue
generated by our connected vehicle business.
•2013 vs. 2012: For the years ended December 31, 2013 and 2012, other revenue was
$344,574 and $283,599, respectively, an increase of 22%, or $60,975. The increase was
driven by revenues from the U.S. Music Royalty Fee as the number of subscribers increased
and subscribers on the 12.5% rate increased, and higher royalty revenue from Sirius XM
Canada.
We expect other revenue to increase as our growing subscriber base drives higher U.S. Music
Royalty Fees.
4