XM Radio 2014 Annual Report Download - page 89
Download and view the complete annual report
Please find page 89 of the 2014 XM Radio annual report below. You can navigate through the pages in the report by either clicking on the pages listed below, or by using the keyword search tool below to find specific information within the annual report.-
 1
1 -
2
-
3
-
4
-
5
-
6
-
7
-
8
-
9
-
10
-
11
-
12
-
13
-
14
-
15
-
16
-
17
-
18
-
19
-
20
-
21
-
22
-
23
-
24
-
25
-
26
-
27
-
28
-
29
-
30
-
31
-
32
-
33
-
34
-
35
-
36
-
37
-
38
-
39
-
40
-
41
-
42
-
43
-
44
-
45
-
46
-
47
-
48
-
49
-
50
-
51
-
52
-
53
-
54
-
55
-
56
-
57
-
58
-
59
-
60
-
61
-
62
-
63
-
64
-
65
-
66
-
67
-
68
-
69
-
70
-
71
-
72
-
73
-
74
-
75
-
76
-
77
-
78
-
 79
79 -
 80
80 -
 81
81 -
 82
82 -
 83
83 -
 84
84 -
 85
85 -
 86
86 -
 87
87 -
 88
88 -
 89
89 -
 90
90 -
 91
91 -
 92
92 -
 93
93 -
 94
94 -
 95
95 -
 96
96 -
 97
97 -
 98
98 -
 99
99 -
100
-
101
-
102
-
103
-
104
-
105
-
106
-
107
-
108
-
109
-
110
-
111
-
112
-
113
-
114
-
115
-
116
-
117
-
118
-
119
-
120
-
121
-
122
-
123
-
124
-
125
-
126
-
127
-
128
-
129
-
130
-
131
-
132
-
133
-
134
-
135
-
136
-
137
-
138
-
139
-
140
-
141
-
142
-
143
-
144
-
145
-
146
-
147
-
148
-
149
 |
 |
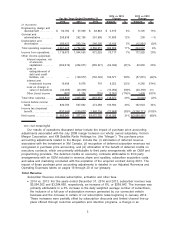
•2014 vs. 2013: For the years ended December 31, 2014 and 2013, general and
administrative expenses were $293,938 and $262,135, respectively, an increase of 12%, or
$31,803, and remained flat as a percentage of total revenue. The increase was primarily
driven by the inclusion of a full year of costs associated with our connected vehicle services
business, as well as higher legal, personnel and facilities costs.
•2013 vs. 2012: For the years ended December 31, 2013 and 2012, general and
administrative expenses were $262,135 and $261,905, respectively, an increase of less than
1%, or $230, but decreased as a percentage of total revenue. The increase was primarily
due to higher information technology costs, offset by lower legal costs.
We expect our general and administrative expenses to increase in future periods as a result of,
among other things, enhanced information technology, on-going legal costs and personnel costs to
support the growth of our business.
Depreciation and Amortization represents the recognition in earnings of the acquisition cost of
assets used in operations, including our satellite constellations, property, equipment and intangible
assets, over their estimated service lives.
•2014 vs. 2013: For the years ended December 31, 2014 and 2013, depreciation and
amortization expense was $266,423 and $253,314, respectively, an increase of 5%, or
$13,109, but decreased as a percentage of total revenue. Depreciation and amortization
expense increased as a result of the inclusion of costs associated with our connected vehicle
services business and additional assets placed in-service, including our FM-6 satellite which
was placed in-service in late 2013. The increase was offset by a reduction of amortization
associated with the stepped-up basis in assets acquired in the Merger (including intangible
assets, satellites, property and equipment) through the end of their estimated useful lives and
certain satellites reaching the end of their estimated useful lives.
•2013 vs. 2012: For the years ended December 31, 2013 and 2012, depreciation and
amortization expense was $253,314 and $266,295, respectively, a decrease of 5%, or
$12,981, and decreased as a percentage of total revenue. The decrease was driven by
certain satellites reaching the end of their estimated useful lives, partially offset by additional
assets placed in-service.
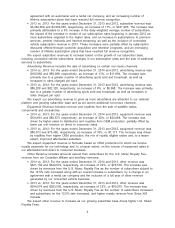
Other Income (Expense)
Interest Expense, Net of Amounts Capitalized, includes interest on outstanding debt, reduced
by interest capitalized in connection with the construction of satellites and related launch vehicles.
•2014 vs. 2013: For the years ended December 31, 2014 and 2013, interest expense was
$269,010 and $204,671, respectively, an increase of 31%, or $64,339. The increase was
primarily due to higher average debt and a reduction in interest capitalized following the
launch of our FM-6 satellite. The increase was partially offset by lower average interest rates
resulting from the redemption or repayment of higher interest rate debt throughout 2013.
•2013 vs. 2012: For the years ended December 31, 2013 and 2012, interest expense was
$204,671 and $265,321, respectively, a decrease of 23%, or $60,650. The decrease was
primarily due to lower average interest rates resulting from the redemption or repayment of
$2,535,500 of higher interest rate debt throughout 2012 and 2013, which was replaced with
$2,650,000 of lower interest rate debt.
We expect interest expense to increase in future periods to the extent our total debt
outstanding increases.
Loss on Extinguishment of Debt and Credit Facilities, Net, includes losses incurred as a result
of the conversion and retirement of certain debt.
•2014 vs. 2013: For the years ended December 31, 2014 and 2013, loss on extinguishment of
debt and credit facilities, net, was $0 and $190,577, respectively. During the year ended
December 31, 2013, a loss was recorded on the extinguishment of our then outstanding
7.625% Senior Notes due 2018 and 8.75% Senior Notes due 2015.
8