XM Radio 2014 Annual Report Download - page 111
Download and view the complete annual report
Please find page 111 of the 2014 XM Radio annual report below. You can navigate through the pages in the report by either clicking on the pages listed below, or by using the keyword search tool below to find specific information within the annual report.-
 1
1 -
2
-
3
-
4
-
5
-
6
-
7
-
8
-
9
-
10
-
11
-
12
-
13
-
14
-
15
-
16
-
17
-
18
-
19
-
20
-
21
-
22
-
23
-
24
-
25
-
26
-
27
-
28
-
29
-
30
-
31
-
32
-
33
-
34
-
35
-
36
-
37
-
38
-
39
-
40
-
41
-
42
-
43
-
44
-
45
-
46
-
47
-
48
-
49
-
50
-
51
-
52
-
53
-
54
-
55
-
56
-
57
-
58
-
59
-
60
-
61
-
62
-
63
-
64
-
65
-
66
-
67
-
68
-
69
-
70
-
71
-
72
-
73
-
74
-
75
-
76
-
77
-
78
-
79
-
80
-
81
-
82
-
83
-
84
-
85
-
86
-
87
-
88
-
89
-
90
-
91
-
92
-
93
-
94
-
95
-
96
-
97
-
98
-
99
-
100
-
 101
101 -
 102
102 -
 103
103 -
 104
104 -
 105
105 -
 106
106 -
 107
107 -
 108
108 -
 109
109 -
 110
110 -
 111
111 -
 112
112 -
 113
113 -
 114
114 -
 115
115 -
 116
116 -
 117
117 -
 118
118 -
 119
119 -
 120
120 -
 121
121 -
122
-
123
-
124
-
125
-
126
-
127
-
128
-
129
-
130
-
131
-
132
-
133
-
134
-
135
-
136
-
137
-
138
-
139
-
140
-
141
-
142
-
143
-
144
-
145
-
146
-
147
-
148
-
149
 |
 |

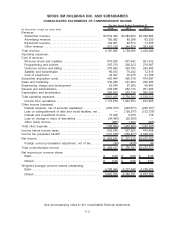
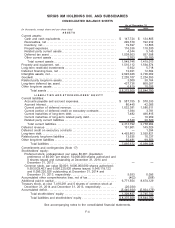
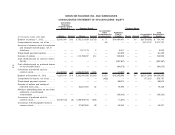
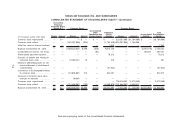
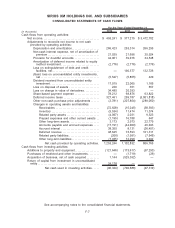
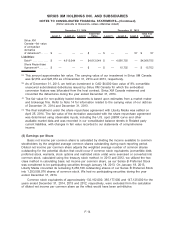
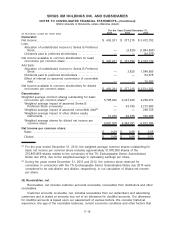
SIRIUS XM HOLDINGS INC. AND SUBSIDIARIES
CONSOLIDATED STATEMENT OF STOCKHOLDERS’ EQUITY
(in thousands, except share data) Shares Amount Shares Amount
Accumulated
Other
Comprehensive
Income (Loss)
Additional
Paid-in
Capital Shares Amount
Accumulated
Deficit
Total
Stockholders’
Equity
Convertible
Perpetual
Preferred Stock,
Series B-1 Common Stock Treasury Stock
Balance at January 1, 2012 . . . . . . . . . . . . . 12,500,000 $13 3,753,201,929 $3,753 $ 71 $10,484,400 — $— $(9,784,092) $ 704,145
Comprehensive income, net of tax . . . . . . — — — — 49 — — — 3,472,702 3,472,751
Issuance of common stock to employees
and employee benefit plans, net of
forfeitures . . . . . . . . . . . . . . . . . . . . . . . . . . . . — — 1,571,175 2 — 3,521 — — — 3,523
Share-based payment expense. . . . . . . . . . — — — — — 60,299 — — — 60,299
Exercise of options . . . . . . . . . . . . . . . . . . . . . — — 214,199,297 214 — 125,695 — — — 125,909
Cash dividends paid on common shares
($0.05). . . . . . . . . . . . . . . . . . . . . . . . . . . . . . . — — — — — (262,387) — — — (262,387)
Cash dividends paid on preferred shares
on as-converted basis . . . . . . . . . . . . . . . . — — — — — (64,675) — — — (64,675)
Conversion of preferred stock to
common stock. . . . . . . . . . . . . . . . . . . . . . . . (6,249,900) (7) 1,293,467,684 1,294 — (1,287) — — — —
Balance at December 31, 2012 . . . . . . . . . 6,250,100 $ 6 5,262,440,085 $5,263 $ 120 $10,345,566 — $— $(6,311,390) $4,039,565
Comprehensive income, net of tax . . . . . . — — — — (428) — — — 377,215 376,787
Share-based payment expense. . . . . . . . . . — — — — — 68,876 — — — 68,876
Exercise of options and vesting of
restricted stock units. . . . . . . . . . . . . . . . . . — — 32,841,381 32 — 19,396 — — — 19,428
Minimum withholding taxes on net share
settlement of stock-based
compensation . . . . . . . . . . . . . . . . . . . . . . . . — — — — — (46,342) — — — (46,342)
Conversion of preferred stock to
common stock. . . . . . . . . . . . . . . . . . . . . . . . (6,250,100) (6) 1,293,509,076 1,293 — (1,287) — — — —
Conversion of Exchangeable Notes to
common stock. . . . . . . . . . . . . . . . . . . . . . . . — — 27,687,850 28 — 45,069 — — — 45,097
F-5