XM Radio 2014 Annual Report Download - page 84
Download and view the complete annual report
Please find page 84 of the 2014 XM Radio annual report below. You can navigate through the pages in the report by either clicking on the pages listed below, or by using the keyword search tool below to find specific information within the annual report.-
 1
1 -
2
-
3
-
4
-
5
-
6
-
7
-
8
-
9
-
10
-
11
-
12
-
13
-
14
-
15
-
16
-
17
-
18
-
19
-
20
-
21
-
22
-
23
-
24
-
25
-
26
-
27
-
28
-
29
-
30
-
31
-
32
-
33
-
34
-
35
-
36
-
37
-
38
-
39
-
40
-
41
-
42
-
43
-
44
-
45
-
46
-
47
-
48
-
49
-
50
-
51
-
52
-
53
-
54
-
55
-
56
-
57
-
58
-
59
-
60
-
61
-
62
-
63
-
64
-
65
-
66
-
67
-
68
-
69
-
70
-
71
-
72
-
73
-
 74
74 -
 75
75 -
 76
76 -
 77
77 -
 78
78 -
 79
79 -
 80
80 -
 81
81 -
 82
82 -
 83
83 -
 84
84 -
 85
85 -
 86
86 -
 87
87 -
 88
88 -
 89
89 -
 90
90 -
 91
91 -
 92
92 -
 93
93 -
 94
94 -
95
-
96
-
97
-
98
-
99
-
100
-
101
-
102
-
103
-
104
-
105
-
106
-
107
-
108
-
109
-
110
-
111
-
112
-
113
-
114
-
115
-
116
-
117
-
118
-
119
-
120
-
121
-
122
-
123
-
124
-
125
-
126
-
127
-
128
-
129
-
130
-
131
-
132
-
133
-
134
-
135
-
136
-
137
-
138
-
139
-
140
-
141
-
142
-
143
-
144
-
145
-
146
-
147
-
148
-
149
 |
 |

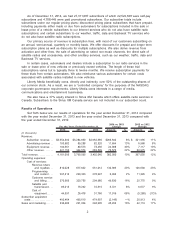
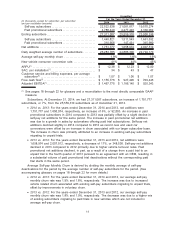
2014 2013 2012 Amount % Amount %
For the Years Ended December 31,
2014 vs 2013
Change
2013 vs 2012
Change
(in thousands)
Engineering, design and
development . . . . . . . . . . . $ 62,784 $ 57,969 $ 48,843 $ 4,815 8% 9,126 19%
General and
administrative . . . . . . . . . . 293,938 262,135 261,905 31,803 12% 230 —%
Depreciation and
amortization. . . . . . . . . . . . 266,423 253,314 266,295 13,109 5% (12,981) (5)%
Total operating expenses . 3,061,425 2,754,542 2,530,015 306,883 11% 224,527 9%
Income from operations. . . 1,119,670 1,044,553 872,025 75,117 7% 172,528 20%
Other income (expense):
Interest expense, net
of amounts
capitalized . . . . . . . . . (269,010) (204,671) (265,321) (64,339) (31)% 60,650 23%
Loss on
extinguishment of
debt and credit
facilities, net . . . . . . . — (190,577) (132,726) 190,577 100% (57,851) (44)%
Interest and
investment income . 15,498 6,976 716 8,522 122% 6,260 874%
Loss on change in
value of derivatives (34,485) (20,393) — (14,092) (69)% (20,393) nm
Other (loss) income . . (887) 1,204 (226) (2,091) (174)% 1,430 633%
Total other expense . . . . . . (288,884) (407,461) (397,557) 118,577 29% (9,904) (2)%
Income before income
taxes . . . . . . . . . . . . . . . . . . 830,786 637,092 474,468 193,694 30% 162,624 34%
Income tax (expense)
benefit . . . . . . . . . . . . . . . . . (337,545) (259,877) 2,998,234 (77,668) (30)% (3,258,111) (109)%
Net income . . . . . . . . . . . . . . $ 493,241 $ 377,215 $3,472,702 $116,026 31% $(3,095,487) (89)%
nm—not meaningful
Our results of operations discussed below include the impact of purchase price accounting
adjustments associated with the July 2008 merger between our wholly owned subsidiary, Vernon
Merger Corporation, and XM Satellite Radio Holdings Inc. (the “Merger”). The purchase price
accounting adjustments related to the Merger, include the: (i) elimination of deferred revenue
associated with the investment in XM Canada, (ii) recognition of deferred subscriber revenues not
recognized in purchase price accounting, and (iii) elimination of the benefit of deferred credits on
executory contracts, which are primarily attributable to third party arrangements with an OEM and
programming providers. The deferred credits on executory contracts attributable to third party
arrangements with an OEM included in revenue share and royalties, subscriber acquisition costs,
and sales and marketing concluded with the expiration of the acquired contract during 2013. The
impact of these purchase price accounting adjustments is detailed in our Adjusted Revenues and
Operating Expenses tables on pages 19 through 20 of our glossary.
Total Revenue
Subscriber Revenue includes subscription, activation and other fees.
•2014 vs. 2013: For the years ended December 31, 2014 and 2013, subscriber revenue was
$3,554,302 and $3,284,660, respectively, an increase of 8%, or $269,642. The increase was
primarily attributable to a 6% increase in the daily weighted average number of subscribers,
the inclusion of a full year of subscription revenue generated by our connected vehicle
business and the increase in certain of our subscription rates beginning in January 2014.
These increases were partially offset by subscription discounts and limited channel line-up
plans offered through customer acquisition and retention programs, a change in an
3