XM Radio 2014 Annual Report Download - page 101
Download and view the complete annual report
Please find page 101 of the 2014 XM Radio annual report below. You can navigate through the pages in the report by either clicking on the pages listed below, or by using the keyword search tool below to find specific information within the annual report.-
 1
1 -
2
-
3
-
4
-
5
-
6
-
7
-
8
-
9
-
10
-
11
-
12
-
13
-
14
-
15
-
16
-
17
-
18
-
19
-
20
-
21
-
22
-
23
-
24
-
25
-
26
-
27
-
28
-
29
-
30
-
31
-
32
-
33
-
34
-
35
-
36
-
37
-
38
-
39
-
40
-
41
-
42
-
43
-
44
-
45
-
46
-
47
-
48
-
49
-
50
-
51
-
52
-
53
-
54
-
55
-
56
-
57
-
58
-
59
-
60
-
61
-
62
-
63
-
64
-
65
-
66
-
67
-
68
-
69
-
70
-
71
-
72
-
73
-
74
-
75
-
76
-
77
-
78
-
79
-
80
-
81
-
82
-
83
-
84
-
85
-
86
-
87
-
88
-
89
-
90
-
 91
91 -
 92
92 -
 93
93 -
 94
94 -
 95
95 -
 96
96 -
 97
97 -
 98
98 -
 99
99 -
 100
100 -
 101
101 -
 102
102 -
 103
103 -
 104
104 -
 105
105 -
 106
106 -
 107
107 -
 108
108 -
 109
109 -
 110
110 -
 111
111 -
112
-
113
-
114
-
115
-
116
-
117
-
118
-
119
-
120
-
121
-
122
-
123
-
124
-
125
-
126
-
127
-
128
-
129
-
130
-
131
-
132
-
133
-
134
-
135
-
136
-
137
-
138
-
139
-
140
-
141
-
142
-
143
-
144
-
145
-
146
-
147
-
148
-
149
 |
 |

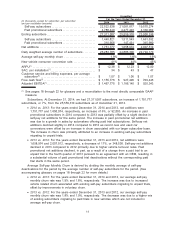
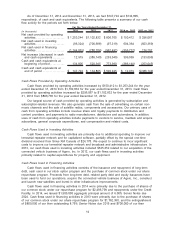
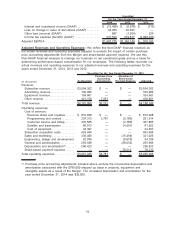
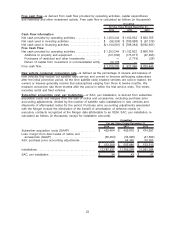
(in thousands) As Reported
Purchase Price
Accounting
Adjustments
Allocation of
Share-based
Payment Expense Adjusted
Unaudited For the Year Ended December 31, 2013
Revenue:
Subscriber revenue. . . . . . . . . . . . . . . . . . $3,284,660 $ — $ — $3,284,660
Advertising revenue . . . . . . . . . . . . . . . . . 89,288 — — 89,288
Equipment revenue. . . . . . . . . . . . . . . . . . 80,573 — — 80,573
Other revenue . . . . . . . . . . . . . . . . . . . . . . 344,574 7,251 — 351,825
Total revenue . . . . . . . . . . . . . . . . . . . . . . . . . $3,799,095 $ 7,251 $ — $3,806,346
Operating expenses
Cost of services:
Revenue share and royalties . . . . . . $ 677,642 $122,534 $ — $ 800,176
Programming and content . . . . . . . . . 290,323 8,033 (7,584) 290,772
Customer service and billing . . . . . . . 320,755 — (2,219) 318,536
Satellite and transmission . . . . . . . . . 79,292 — (3,714) 75,578
Cost of equipment . . . . . . . . . . . . . . . . 26,478 — — 26,478
Subscriber acquisition costs . . . . . . . . . 495,610 64,365 — 559,975
Sales and marketing . . . . . . . . . . . . . . . . 291,024 12,922 (14,792) 289,154
Engineering, design and development 57,969 — (7,405) 50,564
General and administrative . . . . . . . . . . 262,135 — (33,162) 228,973
Depreciation and amortization(a) . . . . . . 253,314 — — 253,314
Share-based payment expense . . . . . . — — 68,876 68,876
Total operating expenses . . . . . . . . . . . . . . $2,754,542 $207,854 $ — $2,962,396
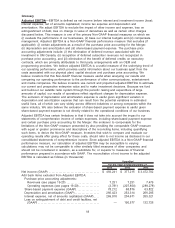
(a) Purchase price accounting adjustments included above exclude the incremental depreciation and
amortization associated with the $785,000 stepped up basis in property, equipment and
intangible assets as a result of the Merger. The increased depreciation and amortization for the
year ended December 31, 2013 was $47,000.
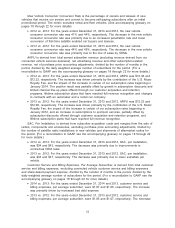
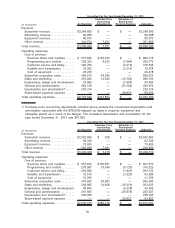
(in thousands) As Reported
Purchase Price
Accounting
Adjustments
Allocation of
Share-based
Payment Expense Adjusted
Unaudited For the Year Ended December 31, 2012
Revenue:
Subscriber revenue. . . . . . . . . . . . . . . . . . $2,962,665 $ 228 $ — $2,962,893
Advertising revenue . . . . . . . . . . . . . . . . . 82,320 — — 82,320
Equipment revenue. . . . . . . . . . . . . . . . . . 73,456 — — 73,456
Other revenue . . . . . . . . . . . . . . . . . . . . . . 283,599 7,251 — 290,850
Total revenue . . . . . . . . . . . . . . . . . . . . . . . . . $3,402,040 $ 7,479 $ — $3,409,519
Operating expenses
Cost of services:
Revenue share and royalties . . . . . . $ 551,012 $146,601 $ — $ 697,613
Programming and content . . . . . . . . . 278,997 37,346 (6,120) 310,223
Customer service and billing . . . . . . . 294,980 — (1,847) 293,133
Satellite and transmission . . . . . . . . . 72,615 — (3,329) 69,286
Cost of equipment . . . . . . . . . . . . . . . . 31,766 — — 31,766
Subscriber acquisition costs . . . . . . . . . 474,697 90,503 — 565,200
Sales and marketing . . . . . . . . . . . . . . . . 248,905 14,828 (10,310) 253,423
Engineering, design and development 48,843 — (6,238) 42,605
General and administrative . . . . . . . . . . 261,905 — (35,978) 225,927
Depreciation and amortization(a) . . . . . . 266,295 — — 266,295
Share-based payment expense . . . . . . — — 63,822 63,822
Total operating expenses . . . . . . . . . . . . . . $2,530,015 $289,278 $ — $2,819,293
20