United Healthcare 2015 Annual Report Download - page 81
Download and view the complete annual report
Please find page 81 of the 2015 United Healthcare annual report below. You can navigate through the pages in the report by either clicking on the pages listed below, or by using the keyword search tool below to find specific information within the annual report.-
 1
1 -
2
-
3
-
4
-
5
-
6
-
7
-
8
-
9
-
10
-
11
-
12
-
13
-
14
-
15
-
16
-
17
-
18
-
19
-
20
-
21
-
22
-
23
-
24
-
25
-
26
-
27
-
28
-
29
-
30
-
31
-
32
-
33
-
34
-
35
-
36
-
37
-
38
-
39
-
40
-
41
-
42
-
43
-
44
-
45
-
46
-
47
-
48
-
49
-
50
-
51
-
52
-
53
-
54
-
55
-
56
-
57
-
58
-
59
-
60
-
61
-
62
-
63
-
64
-
65
-
66
-
67
-
68
-
69
-
70
-
 71
71 -
 72
72 -
 73
73 -
 74
74 -
 75
75 -
 76
76 -
 77
77 -
 78
78 -
 79
79 -
 80
80 -
 81
81 -
 82
82 -
 83
83 -
 84
84 -
 85
85 -
 86
86 -
 87
87 -
 88
88 -
 89
89 -
 90
90 -
 91
91 -
92
-
93
-
94
-
95
-
96
-
97
-
98
-
99
-
100
-
101
-
102
-
103
-
104
-
105
-
106
-
107
-
108
-
109
-
110
-
111
-
112
-
113
 |
 |

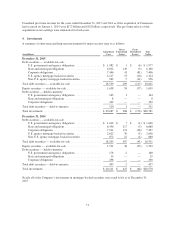
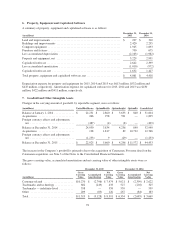
The acquisition date fair values and weighted-average useful lives assigned to finite-lived intangible assets
acquired in business combinations consisted of the following by year of acquisition:
2015 2014
(in millions, except years)
Fair
Value
Weighted-
Average
Useful Life
Fair
Value
Weighted-
Average
Useful Life
Customer-related ............................................ $5,518 19 years $314 14 years
Trademarks and technology .................................... 194 4years 148 6 years
Other ...................................................... — 2 14years
Total acquired finite-lived intangible assets ....................... $5,712 19 years $464 11 years
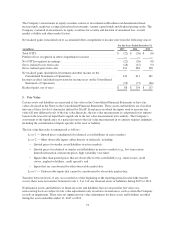
Estimated full year amortization expense relating to intangible assets for each of the next five years ending
December 31 is as follows:
(in millions)
2016 ................................................................................. $808
2017 ................................................................................. 772
2018 ................................................................................. 668
2019 ................................................................................. 612
2020 ................................................................................. 543
Amortization expense relating to intangible assets for December 31, 2015, 2014 and 2013 was $650 million,
$524 million and $519 million, respectively.
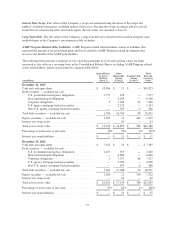
8. Medical Costs Payable
The following table shows the components of the change in medical costs payable for the years ended
December 31:
(in millions) 2015 2014 2013
Medical costs payable, beginning of period ............................ $ 12,040 $ 11,575 $ 11,004
Reported medical costs:
Current year ................................................ 104,195 94,053 90,339
Prior years ................................................. (320) (420) (680)
Total reported medical costs ....................................... 103,875 93,633 89,659
Claim payments:
Payments for current year ..................................... (90,630) (82,750) (79,358)
Payments for prior year ....................................... (10,955) (10,418) (9,730)
Total claim payments ............................................. (101,585) (93,168) (89,088)
Medical costs payable, end of period ................................. $ 14,330 $ 12,040 $ 11,575
For the years ended December 31, 2015 and 2014, the favorable medical cost reserve development was due to a
number of individual factors that were not material. The net favorable development for the year ended
December 31, 2013 was primarily driven by lower than expected health system utilization levels.
79