United Healthcare 2015 Annual Report Download - page 77
Download and view the complete annual report
Please find page 77 of the 2015 United Healthcare annual report below. You can navigate through the pages in the report by either clicking on the pages listed below, or by using the keyword search tool below to find specific information within the annual report.-
 1
1 -
2
-
3
-
4
-
5
-
6
-
7
-
8
-
9
-
10
-
11
-
12
-
13
-
14
-
15
-
16
-
17
-
18
-
19
-
20
-
21
-
22
-
23
-
24
-
25
-
26
-
27
-
28
-
29
-
30
-
31
-
32
-
33
-
34
-
35
-
36
-
37
-
38
-
39
-
40
-
41
-
42
-
43
-
44
-
45
-
46
-
47
-
48
-
49
-
50
-
51
-
52
-
53
-
54
-
55
-
56
-
57
-
58
-
59
-
60
-
61
-
62
-
63
-
64
-
65
-
66
-
 67
67 -
 68
68 -
 69
69 -
 70
70 -
 71
71 -
 72
72 -
 73
73 -
 74
74 -
 75
75 -
 76
76 -
 77
77 -
 78
78 -
 79
79 -
 80
80 -
 81
81 -
 82
82 -
 83
83 -
 84
84 -
 85
85 -
 86
86 -
 87
87 -
88
-
89
-
90
-
91
-
92
-
93
-
94
-
95
-
96
-
97
-
98
-
99
-
100
-
101
-
102
-
103
-
104
-
105
-
106
-
107
-
108
-
109
-
110
-
111
-
112
-
113
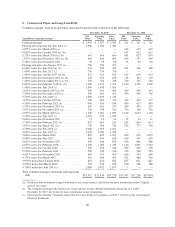
 |
 |

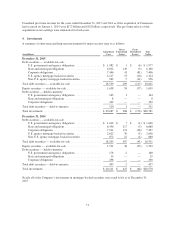
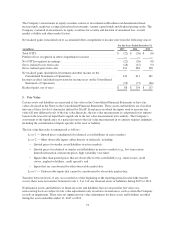
Interest Rate Swaps. Fair values of the Company’s swaps are estimated using the terms of the swaps and
publicly available information, including market yield curves. Because the swaps are unique and not actively
traded but are valued using other observable inputs, the fair values are classified as Level 2.
Long-Term Debt. The fair values of the Company’s long-term debt are estimated and classified using the same
methodologies as the Company’s investments in debt securities.
AARP Program-Related Other Liabilities. AARP Program-related other liabilities consist of liabilities that
represent the amount of net investment gains and losses related to AARP Program-related investments that
accrue to the benefit of the AARP policyholders.
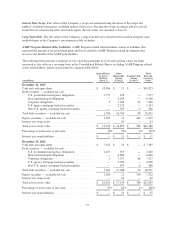
The following table presents a summary of fair value measurements by level and carrying values for items
measured at fair value on a recurring basis in the Consolidated Balance Sheets excluding AARP Program-related
assets and liabilities, which are presented in a separate table below:
(in millions)
Quoted Prices
in Active
Markets
(Level 1)
Other
Observable
Inputs
(Level 2)
Unobservable
Inputs
(Level 3)
Total
Fair and
Carrying
Value
December 31, 2015
Cash and cash equivalents ............................ $ 10,906 $ 17 $ — $10,923
Debt securities — available-for-sale:
U.S. government and agency obligations ............. 1,779 198 — 1,977
State and municipal obligations .................... — 6,168 — 6,168
Corporate obligations ............................ 5 7,308 93 7,406
U.S. agency mortgage-backed securities ............. — 2,124 — 2,124
Non-U.S. agency mortgage-backed securities ......... — 951 5 956
Total debt securities — available-for-sale ................ 1,784 16,749 98 18,631
Equity securities — available-for-sale ................... 1,223 14 402 1,639
Interest rate swap assets .............................. — 93 — 93
Total assets at fair value .............................. $ 13,913 $ 16,873 $ 500 $31,286
Percentage of total assets at fair value ................... 44% 54% 2% 100%
Interest rate swap liabilities ........................... $ — $ 11 $ — $ 11
December 31, 2014
Cash and cash equivalents ............................ $ 7,472 $ 23 $ — $ 7,495
Debt securities — available-for-sale:
U.S. government and agency obligations ............. 1,427 193 — 1,620
State and municipal obligations .................... — 6,668 — 6,668
Corporate obligations ............................ 2 7,257 68 7,327
U.S. agency mortgage-backed securities ............. — 2,056 — 2,056
Non-U.S. agency mortgage-backed securities ......... — 874 6 880
Total debt securities — available-for-sale ................ 1,429 17,048 74 18,551
Equity securities — available-for-sale ................... 1,200 12 310 1,522
Interest rate swap assets .............................. — 62 — 62
Total assets at fair value .............................. $ 10,101 $ 17,145 $ 384 $27,630
Percentage of total assets at fair value ................... 37% 62% 1% 100%
Interest rate swap liabilities ........................... $ — $ 55 $ — $ 55
75