United Healthcare 2015 Annual Report Download - page 75
Download and view the complete annual report
Please find page 75 of the 2015 United Healthcare annual report below. You can navigate through the pages in the report by either clicking on the pages listed below, or by using the keyword search tool below to find specific information within the annual report.-
 1
1 -
2
-
3
-
4
-
5
-
6
-
7
-
8
-
9
-
10
-
11
-
12
-
13
-
14
-
15
-
16
-
17
-
18
-
19
-
20
-
21
-
22
-
23
-
24
-
25
-
26
-
27
-
28
-
29
-
30
-
31
-
32
-
33
-
34
-
35
-
36
-
37
-
38
-
39
-
40
-
41
-
42
-
43
-
44
-
45
-
46
-
47
-
48
-
49
-
50
-
51
-
52
-
53
-
54
-
55
-
56
-
57
-
58
-
59
-
60
-
61
-
62
-
63
-
64
-
 65
65 -
 66
66 -
 67
67 -
 68
68 -
 69
69 -
 70
70 -
 71
71 -
 72
72 -
 73
73 -
 74
74 -
 75
75 -
 76
76 -
 77
77 -
 78
78 -
 79
79 -
 80
80 -
 81
81 -
 82
82 -
 83
83 -
 84
84 -
 85
85 -
86
-
87
-
88
-
89
-
90
-
91
-
92
-
93
-
94
-
95
-
96
-
97
-
98
-
99
-
100
-
101
-
102
-
103
-
104
-
105
-
106
-
107
-
108
-
109
-
110
-
111
-
112
-
113
 |
 |

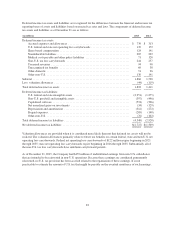
The Company’s investments in equity securities consist of investments in Brazilian real denominated fixed-
income funds, employee savings plan related investments, venture capital funds and dividend paying stocks. The
Company evaluated its investments in equity securities for severity and duration of unrealized loss, overall
market volatility and other market factors.
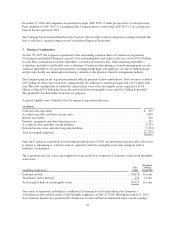
Net realized gains reclassified out of accumulated other comprehensive income were from the following sources:
For the Years Ended December 31,
(in millions) 2015 2014 2013
Total OTTI ....................................................... $ (22) $ (26) $ (8)
Portion of loss recognized in other comprehensive income .................———
Net OTTI recognized in earnings ..................................... (22) (26) (8)
Gross realized losses from sales ...................................... (28) (47) (9)
Gross realized gains from sales ....................................... 191 284 198
Net realized gains (included in investment and other income on the
Consolidated Statements of Operations) .............................. 141 211 181
Income tax effect (included in provision for income taxes on the Consolidated
Statements of Operations) ......................................... (53) (77) (66)
Realized gains, net of taxes .......................................... $ 88 $ 134 $ 115
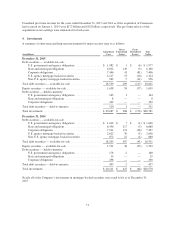
5. Fair Value
Certain assets and liabilities are measured at fair value in the Consolidated Financial Statements or have fair
values disclosed in the Notes to the Consolidated Financial Statements. These assets and liabilities are classified
into one of three levels of a hierarchy defined by GAAP. In instances in which the inputs used to measure fair
value fall into different levels of the fair value hierarchy, the fair value measurement is categorized in its entirety
based on the lowest level input that is significant to the fair value measurement in its entirety. The Company’s
assessment of the significance of a particular item to the fair value measurement in its entirety requires judgment,
including the consideration of inputs specific to the asset or liability.
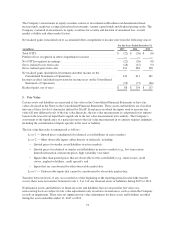
The fair value hierarchy is summarized as follows:
Level 1 — Quoted prices (unadjusted) for identical assets/liabilities in active markets.
Level 2 — Other observable inputs, either directly or indirectly, including:
• Quoted prices for similar assets/liabilities in active markets;
• Quoted prices for identical or similar assets/liabilities in inactive markets (e.g., few transactions,
limited information, noncurrent prices, high variability over time);
• Inputs other than quoted prices that are observable for the asset/liability (e.g., interest rates, yield
curves, implied volatilities, credit spreads); and
• Inputs that are corroborated by other observable market data.
Level 3 — Unobservable inputs that cannot be corroborated by observable market data.
Transfers between levels, if any, are recorded as of the beginning of the reporting period in which the transfer
occurs; there were no transfers between Levels 1, 2 or 3 of any financial assets or liabilities during 2015 or 2014.
Nonfinancial assets and liabilities or financial assets and liabilities that are measured at fair value on a
nonrecurring basis are subject to fair value adjustments only in certain circumstances, such as when the Company
records an impairment. There were no significant fair value adjustments for these assets and liabilities recorded
during the years ended December 31, 2015 or 2014.
73