United Healthcare 2015 Annual Report Download - page 35
Download and view the complete annual report
Please find page 35 of the 2015 United Healthcare annual report below. You can navigate through the pages in the report by either clicking on the pages listed below, or by using the keyword search tool below to find specific information within the annual report.-
 1
1 -
2
-
3
-
4
-
5
-
6
-
7
-
8
-
9
-
10
-
11
-
12
-
13
-
14
-
15
-
16
-
17
-
18
-
19
-
20
-
21
-
22
-
23
-
24
-
 25
25 -
 26
26 -
 27
27 -
 28
28 -
 29
29 -
 30
30 -
 31
31 -
 32
32 -
 33
33 -
 34
34 -
 35
35 -
 36
36 -
 37
37 -
 38
38 -
 39
39 -
 40
40 -
 41
41 -
 42
42 -
 43
43 -
 44
44 -
 45
45 -
46
-
47
-
48
-
49
-
50
-
51
-
52
-
53
-
54
-
55
-
56
-
57
-
58
-
59
-
60
-
61
-
62
-
63
-
64
-
65
-
66
-
67
-
68
-
69
-
70
-
71
-
72
-
73
-
74
-
75
-
76
-
77
-
78
-
79
-
80
-
81
-
82
-
83
-
84
-
85
-
86
-
87
-
88
-
89
-
90
-
91
-
92
-
93
-
94
-
95
-
96
-
97
-
98
-
99
-
100
-
101
-
102
-
103
-
104
-
105
-
106
-
107
-
108
-
109
-
110
-
111
-
112
-
113
 |
 |
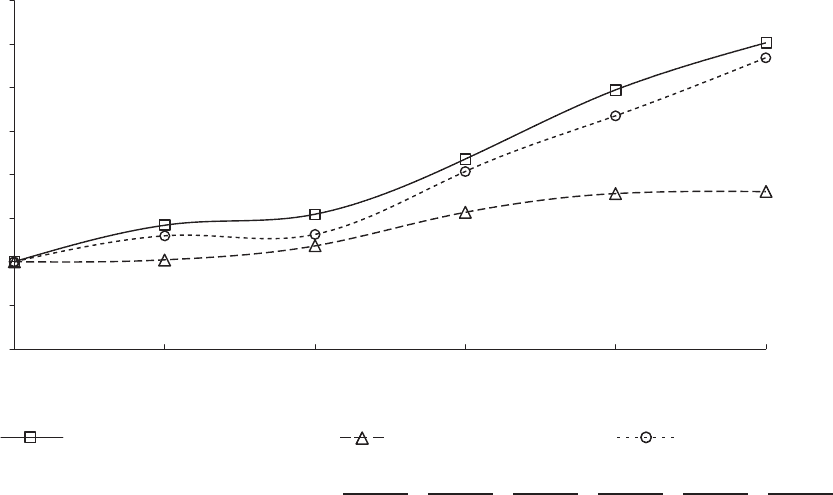
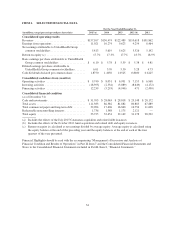
Peer Group
The companies included in our peer group are Aetna Inc., Anthem Inc., Cigna Corporation and Humana Inc. We
believe that this peer group reflects publicly traded peers to our UnitedHealthcare businesses.
COMPARISON OF 5 YEAR CUMULATIVE TOTAL RETURN
Among UnitedHealth Group, the S&P 500 Index,
and a Peer Group
UnitedHealth Group S&P 500 Peer Group
$0
$150
$100
$50
$250
$300
$200
$400
$350
12/10 12/11 12/12 12/13 12/14 12/15
12/10 12/11 12/12 12/13 12/14 12/15
UnitedHealth Group ...................... $100.00 $142.19 $154.40 $217.75 $297.14 $351.39
S&P 500 Index ........................... 100.00 102.11 118.45 156.82 178.29 180.75
Peer Group .............................. 100.00 129.91 131.22 203.90 267.72 334.49
The stock price performance included in this graph is not necessarily indicative of future stock price
performance.
33