United Healthcare 2015 Annual Report Download - page 36
Download and view the complete annual report
Please find page 36 of the 2015 United Healthcare annual report below. You can navigate through the pages in the report by either clicking on the pages listed below, or by using the keyword search tool below to find specific information within the annual report.-
 1
1 -
2
-
3
-
4
-
5
-
6
-
7
-
8
-
9
-
10
-
11
-
12
-
13
-
14
-
15
-
16
-
17
-
18
-
19
-
20
-
21
-
22
-
23
-
24
-
25
-
 26
26 -
 27
27 -
 28
28 -
 29
29 -
 30
30 -
 31
31 -
 32
32 -
 33
33 -
 34
34 -
 35
35 -
 36
36 -
 37
37 -
 38
38 -
 39
39 -
 40
40 -
 41
41 -
 42
42 -
 43
43 -
 44
44 -
 45
45 -
 46
46 -
47
-
48
-
49
-
50
-
51
-
52
-
53
-
54
-
55
-
56
-
57
-
58
-
59
-
60
-
61
-
62
-
63
-
64
-
65
-
66
-
67
-
68
-
69
-
70
-
71
-
72
-
73
-
74
-
75
-
76
-
77
-
78
-
79
-
80
-
81
-
82
-
83
-
84
-
85
-
86
-
87
-
88
-
89
-
90
-
91
-
92
-
93
-
94
-
95
-
96
-
97
-
98
-
99
-
100
-
101
-
102
-
103
-
104
-
105
-
106
-
107
-
108
-
109
-
110
-
111
-
112
-
113
 |
 |

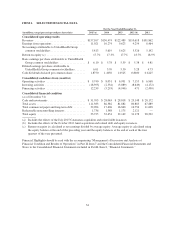
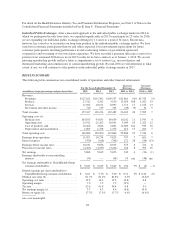
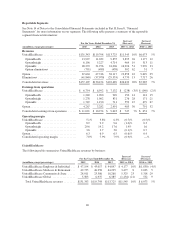
ITEM 6. SELECTED FINANCIAL DATA
For the Year Ended December 31,
(in millions, except percentages and per share data) 2015 (a) 2014 2013 2012 (b) 2011
Consolidated operating results
Revenues ................................... $157,107 $130,474 $122,489 $110,618 $101,862
Earnings from operations ....................... 11,021 10,274 9,623 9,254 8,464
Net earnings attributable to UnitedHealth Group
common stockholders ........................ 5,813 5,619 5,625 5,526 5,142
Return on equity (c) ........................... 17.7% 17.3% 17.7% 18.7% 18.9%
Basic earnings per share attributable to UnitedHealth
Group common stockholders .................. $ 6.10 $ 5.78 $ 5.59 $ 5.38 $ 4.81
Diluted earnings per share attributable to
UnitedHealth Group common stockholders ....... 6.01 5.70 5.50 5.28 4.73
Cash dividends declared per common share ........ 1.8750 1.4050 1.0525 0.8000 0.6125
Consolidated cash flows from (used for)
Operating activities ........................... $ 9,740 $ 8,051 $ 6,991 $ 7,155 $ 6,968
Investing activities ............................ (18,395) (2,534) (3,089) (8,649) (4,172)
Financing activities ........................... 12,239 (5,293) (4,946) 471 (2,490)
Consolidated financial condition
(as of December 31)
Cash and investments .......................... $ 31,703 $ 28,063 $ 28,818 $ 29,148 $ 28,172
Total assets .................................. 111,383 86,382 81,882 80,885 67,889
Total commercial paper and long-term debt ........ 32,094 17,406 16,860 16,754 11,638
Redeemable noncontrolling interests .............. 1,736 1,388 1,175 2,121 —
Total equity ................................. 33,725 32,454 32,149 31,178 28,292
(a) Includes the effects of the July 2015 Catamaran acquisition and related debt issuances.
(b) Includes the effects of the October 2012 Amil acquisition and related debt and equity issuances.
(c) Return on equity is calculated as net earnings divided by average equity. Average equity is calculated using
the equity balance at the end of the preceding year and the equity balances at the end of each of the four
quarters of the year presented.
Financial Highlights should be read with the accompanying “Management’s Discussion and Analysis of
Financial Condition and Results of Operations” in Part II, Item 7 and the Consolidated Financial Statements and
Notes to the Consolidated Financial Statements included in Part II, Item 8, “Financial Statements.”
34