United Healthcare 2015 Annual Report Download - page 61
Download and view the complete annual report
Please find page 61 of the 2015 United Healthcare annual report below. You can navigate through the pages in the report by either clicking on the pages listed below, or by using the keyword search tool below to find specific information within the annual report.-
 1
1 -
2
-
3
-
4
-
5
-
6
-
7
-
8
-
9
-
10
-
11
-
12
-
13
-
14
-
15
-
16
-
17
-
18
-
19
-
20
-
21
-
22
-
23
-
24
-
25
-
26
-
27
-
28
-
29
-
30
-
31
-
32
-
33
-
34
-
35
-
36
-
37
-
38
-
39
-
40
-
41
-
42
-
43
-
44
-
45
-
46
-
47
-
48
-
49
-
50
-
 51
51 -
 52
52 -
 53
53 -
 54
54 -
 55
55 -
 56
56 -
 57
57 -
 58
58 -
 59
59 -
 60
60 -
 61
61 -
 62
62 -
 63
63 -
 64
64 -
 65
65 -
 66
66 -
 67
67 -
 68
68 -
 69
69 -
 70
70 -
 71
71 -
72
-
73
-
74
-
75
-
76
-
77
-
78
-
79
-
80
-
81
-
82
-
83
-
84
-
85
-
86
-
87
-
88
-
89
-
90
-
91
-
92
-
93
-
94
-
95
-
96
-
97
-
98
-
99
-
100
-
101
-
102
-
103
-
104
-
105
-
106
-
107
-
108
-
109
-
110
-
111
-
112
-
113
 |
 |

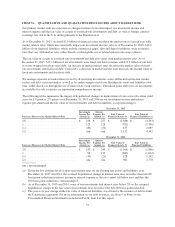
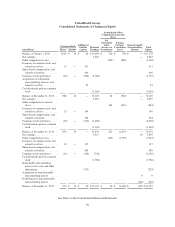
UnitedHealth Group
Consolidated Statements of Changes in Equity
Accumulated Other
Comprehensive Income
(Loss)
(in millions)
Common Stock Additional
Paid-In
Capital
Retained
Earnings
Net
Unrealized
Gains
(Losses) on
Investments
Foreign
Currency
Translation
Losses
Nonredeemable
Noncontrolling
Interest
Total
EquityShares Amount
Balance at January 1, 2013 ...... 1,019 $ 10 $ 66 $ 30,664 $ 516 $ (78) $ — $31,178
Net earnings ................. 5,625 — 5,625
Other comprehensive loss ....... (462) (884) (1,346)
Issuances of common stock, and
related tax effects ........... 17 — 431 431
Share-based compensation, and
related tax benefits .......... 406 406
Common stock repurchases ..... (48) — (984) (2,186) (3,170)
Acquisition of redeemable
noncontrolling interests and
related tax effects ........... 81 81
Cash dividends paid on common
stock ..................... (1,056) (1,056)
Balance at December 31, 2013 . . . 988 10 — 33,047 54 (962) — 32,149
Net earnings ................. 5,619 — 5,619
Other comprehensive income
(loss) ..................... 169 (653) (484)
Issuances of common stock, and
related tax effects ........... 15 — 146 146
Share-based compensation, and
related tax benefits .......... 394 394
Common stock repurchases ..... (49) — (540) (3,468) (4,008)
Cash dividends paid on common
stock ..................... (1,362) (1,362)
Balance at December 31, 2014 . . . 954 10 — 33,836 223 (1,615) — 32,454
Net earnings ................. 5,813 26 5,839
Other comprehensive loss ....... (167) (1,775) (1,942)
Issuances of common stock, and
related tax effects ........... 10 — 127 127
Share-based compensation, and
related tax benefits .......... 589 589
Common stock repurchases ..... (11) — (462) (738) (1,200)
Cash dividends paid on common
stock ..................... (1,786) (1,786)
Redeemable noncontrolling
interests fair value and other
adjustments ................ (225) (225)
Acquisition of nonredeemable
noncontrolling interest ....... 99
Distributions to nonredeemable
noncontrolling interest ....... (140) (140)
Balance at December 31, 2015 . . . 953 $ 10 $ 29 $ 37,125 $ 56 $ (3,390) $ (105) $33,725
See Notes to the Consolidated Financial Statements
59