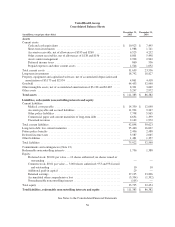
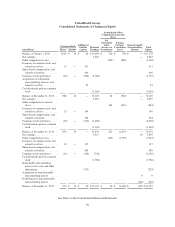
United Healthcare 2015 Annual Report Download - page 51
Download and view the complete annual report
Please find page 51 of the 2015 United Healthcare annual report below. You can navigate through the pages in the report by either clicking on the pages listed below, or by using the keyword search tool below to find specific information within the annual report.-
 1
1 -
2
-
3
-
4
-
5
-
6
-
7
-
8
-
9
-
10
-
11
-
12
-
13
-
14
-
15
-
16
-
17
-
18
-
19
-
20
-
21
-
22
-
23
-
24
-
25
-
26
-
27
-
28
-
29
-
30
-
31
-
32
-
33
-
34
-
35
-
36
-
37
-
38
-
39
-
40
-
 41
41 -
 42
42 -
 43
43 -
 44
44 -
 45
45 -
 46
46 -
 47
47 -
 48
48 -
 49
49 -
 50
50 -
 51
51 -
 52
52 -
 53
53 -
 54
54 -
 55
55 -
 56
56 -
 57
57 -
 58
58 -
 59
59 -
 60
60 -
 61
61 -
62
-
63
-
64
-
65
-
66
-
67
-
68
-
69
-
70
-
71
-
72
-
73
-
74
-
75
-
76
-
77
-
78
-
79
-
80
-
81
-
82
-
83
-
84
-
85
-
86
-
87
-
88
-
89
-
90
-
91
-
92
-
93
-
94
-
95
-
96
-
97
-
98
-
99
-
100
-
101
-
102
-
103
-
104
-
105
-
106
-
107
-
108
-
109
-
110
-
111
-
112
-
113
 |
 |

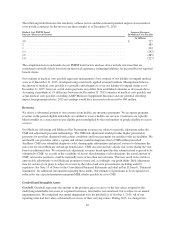
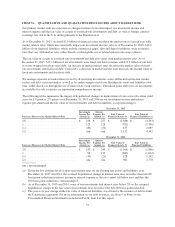
The following table illustrates the sensitivity of these factors and the estimated potential impact on our medical
costs payable estimates for the most recent three months as of December 31, 2015:
Medical Cost PMPM Trend
Increase (Decrease) in Factors
Increase (Decrease)
In Medical Costs Payable
(in millions)
3%..................................................................... $ 727
2 ...................................................................... 485
1 ...................................................................... 242
(1) ..................................................................... (242)
(2) ..................................................................... (485)
(3) ..................................................................... (727)
The completion factors and medical costs PMPM trend factors analyses above include outcomes that are
considered reasonably likely based on our historical experience estimating liabilities for incurred but not reported
benefit claims.
Our estimate of medical costs payable represents management’s best estimate of our liability for unpaid medical
costs as of December 31, 2015, developed using consistently applied actuarial methods. Management believes
the amount of medical costs payable is reasonable and adequate to cover our liability for unpaid claims as of
December 31, 2015; however, actual claim payments may differ from established estimates as discussed above.
Assuming a hypothetical 1% difference between our December 31, 2015 estimates of medical costs payable and
actual medical costs payable, excluding AARP Medicare Supplement Insurance and any potential offsetting
impact from premium rebates, 2015 net earnings would have increased or decreased by $83 million.
Revenues
We derive a substantial portion of our revenues from health care insurance premiums. We recognize premium
revenues in the period eligible individuals are entitled to receive health care services. Customers are typically
billed monthly at a contracted rate per eligible person multiplied by the total number of people eligible to receive
services.
Our Medicare Advantage and Medicare Part D premium revenues are subject to periodic adjustment under the
CMS risk adjustment payment methodology. The CMS risk adjustment model provides higher per member
payments for enrollees diagnosed with certain conditions and lower payments for enrollees who are healthier. We
and health care providers collect, capture and submit available diagnosis data to CMS within prescribed
deadlines. CMS uses submitted diagnosis codes, demographic information and special statuses to determine the
risk score for most Medicare Advantage beneficiaries. CMS also retroactively adjusts risk scores during the year
based on additional data. We estimate risk adjustment revenues based upon the data submitted and expected to be
submitted to CMS. As a result of the variability of factors that determine such estimations, the actual amount of
CMS’ retroactive payments could be materially more or less than our estimates. This may result in favorable or
unfavorable adjustments to our Medicare premium revenue and, accordingly, our profitability. Risk adjustment
data for certain of our plans is subject to review by the federal and state governments, including audit by
regulators. See Note 13 of Notes to the Consolidated Financial Statements included in Part II, Item 8, “Financial
Statements” for additional information regarding these audits. Our estimates of premiums to be recognized are
reduced by any expected premium minimum MLR rebates payable by us to CMS.
Goodwill and Intangible Assets
Goodwill. Goodwill represents the amount of the purchase price in excess of the fair values assigned to the
underlying identifiable net assets of acquired businesses. Goodwill is not amortized, but is subject to an annual
impairment test. We completed our annual impairment tests for goodwill as of October 1, 2015. All of our
reporting units had fair values substantially in excess of their carrying values. During 2015, we changed our
49