TJ Maxx 1997 Annual Report Download - page 3
Download and view the complete annual report
Please find page 3 of the 1997 TJ Maxx annual report below. You can navigate through the pages in the report by either clicking on the pages listed below, or by using the keyword search tool below to find specific information within the annual report.-
 1
1 -
 2
2 -
 3
3 -
 4
4 -
 5
5 -
 6
6 -
 7
7 -
 8
8 -
 9
9 -
 10
10 -
 11
11 -
 12
12 -
 13
13 -
 14
14 -
15
-
16
-
17
-
18
-
19
-
20
-
21
-
22
-
23
-
24
-
25
-
26
-
27
 |
 |

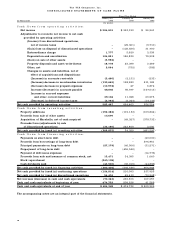
T h e T J X C o m p a n i e s , I n c .
C O N S O L I D A T E D S T A T E M E N T S O F C A S H F L O W S
Fiscal Year Ended
J a n u a r y 31, J a n u a r y 25, J a n u a r y 27,
In Thousands 1 9 9 8 1 9 9 7 1 9 9 6
(53 weeks)
C a s h f l o w s f r o m o p e r a t i n g a c t i v i t i e s :
Net income $ 304,815 $ 363,123 $ 26,261
Adjustments to reconcile net income to net cash
p rovided by operating activities:
(Income) from discontinued operations,
net of income taxes – ( 2 9 , 3 6 1 ) ( 9 , 7 1 0 )
(Gain) loss on disposal of discontinued operations – ( 1 2 5 , 5 5 6 ) 3 1 , 7 0 0
E x t r a o rd i n a ry charg e 1 , 7 7 7 5 , 6 2 0 3 , 3 3 8
D e p reciation and amort i z a t i o n 1 2 4 , 8 9 1 1 2 6 , 8 3 0 7 9 , 2 3 2
(Gain) on sale of other assets ( 5 , 9 9 2 ) – –
P ro p e rty disposals and asset write-downs 1 8 , 7 7 8 2 5 , 3 9 9 3 , 4 8 9
O t h e r, net 2 , 0 6 4 ( 7 3 2 ) ( 3 8 2 )
Changes in assets and liabilities, net of
e ffect of acquisitions and dispositions:
( I n c rease) in accounts re c e i v a b l e ( 3 , 4 6 0 ) ( 2 , 1 3 1 ) ( 2 3 3 )
( I n c rease) decrease in merchandise inventories ( 1 3 0 , 6 6 5 ) 1 9 8 , 9 8 3 2 1 1 , 1 6 8
( I n c rease) decrease in prepaid expenses ( 1 0 , 9 7 8 ) 2 7 6 , 8 7 2
I n c rease (decrease) in accounts payable 4 8 , 8 4 6 9 5 , 6 7 7 ( 1 4 7 , 0 1 3 )
I n c rease in accrued expenses
and other current liabilities 3 9 , 1 8 4 1 1 , 9 2 8 6 3 , 9 7 5
( D e c rease) in deferred income taxes ( 3 , 7 9 3 ) ( 5 , 3 4 4 ) ( 1 4 , 1 4 3 )
Net cash provided by operating activities 3 8 5 , 4 6 7 6 6 4 , 4 6 3 2 5 4 , 5 5 4
C a s h f l o w s f r o m i n v e s t i n g a c t i v i t i e s :
P ro p e rty additions ( 1 9 2 , 3 8 2 ) ( 1 1 9 , 1 5 3 ) ( 1 0 5 , 8 6 4 )
P roceeds from sale of other assets 1 5 , 6 9 7 – –
Acquisition of Marshalls, net of cash acquire d – ( 4 9 , 3 2 7 ) ( 3 7 8 , 7 3 3 )
Proceeds from (adjustments to) sale
of discontinued operations ( 3 3 , 1 9 0 ) 2 2 2 , 8 0 0 3 , 0 0 0
Net cash provided by (used in) investing activities ( 2 0 9 , 8 7 5 ) 5 4 , 3 2 0 ( 4 8 1 , 5 9 7 )
C a s h f l o w s f r o m f i n a n c i n g a c t i v i t i e s :
Payments on short - t e rm debt – –( 2 0 , 0 0 0 )
P roceeds from borrowings of long-term debt – –5 7 4 , 8 6 1
Principal payments on long-term debt ( 2 7 , 1 7 9 ) ( 4 6 , 5 0 6 ) ( 3 1 , 2 7 1 )
P repayment of long-term debt – ( 4 5 5 , 5 6 0 ) –
Payment of debt issue expenses – –( 1 4 , 7 7 6 )
P roceeds from sale and issuance of common stock, net 1 5 , 4 7 1 3 4 , 3 9 5 1 , 0 4 0
Stock re p u rc h a s e d ( 2 4 5 , 1 9 8 ) – –
Cash dividends paid ( 4 3 , 5 0 0 ) ( 3 5 , 0 1 9 ) ( 4 4 , 8 8 6 )
Net cash provided by (used in) financing activities ( 3 0 0 , 4 0 6 ) ( 5 0 2 , 6 9 0 ) 4 6 4 , 9 6 8
Net cash provided by (used in) continuing operations ( 1 2 4 , 8 1 4 ) 2 1 6 , 0 9 3 2 3 7 , 9 2 5
Net cash provided by (used in) discontinued operations 5 4 , 4 5 1 4 9 , 4 1 3 ( 7 0 , 2 6 8 )
Net increase (decrease) in cash and cash equivalents ( 7 0 , 3 6 3 ) 2 6 5 , 5 0 6 1 6 7 , 6 5 7
Cash and cash equivalents at beginning of year 4 7 4 , 7 3 2 2 0 9 , 2 2 6 4 1 , 5 6 9
Cash and cash equivalents at end of year $ 404,369 $ 474,732 $ 2 0 9 , 2 2 6
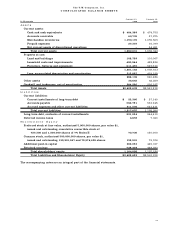
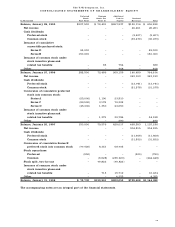
The accompanying notes are an integral part of the financial statements.
18