TJ Maxx 1997 Annual Report Download - page 14
Download and view the complete annual report
Please find page 14 of the 1997 TJ Maxx annual report below. You can navigate through the pages in the report by either clicking on the pages listed below, or by using the keyword search tool below to find specific information within the annual report.-
 1
1 -
2
-
3
-
 4
4 -
 5
5 -
 6
6 -
 7
7 -
 8
8 -
 9
9 -
 10
10 -
 11
11 -
 12
12 -
 13
13 -
 14
14 -
 15
15 -
 16
16 -
 17
17 -
 18
18 -
 19
19 -
 20
20 -
 21
21 -
 22
22 -
 23
23 -
 24
24 -
25
-
26
-
27
 |
 |

29
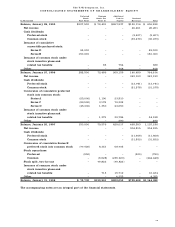
On June 25, 1997, the Company authorized the re p u rchase of up to $250 million of the Company’s
common shares and common equivalent shares. During fiscal 1998, the Company re p u rchased 8.5 million
s h a res of its stock, totaling $245.2 million, re p resenting approximately 5% of the Company’s outstanding
common shares. In Febru a ry 1998, the Company completed this buy back program with a total of 8.7 mil-
lion shares having been re p u rchased. At the same time, the Company announced its intent to re p u rc h a s e
an additional $250 million of the Company’s common stock.
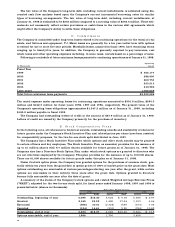
E a r n i n g s P e r S h a r e : The Company calculates earnings per share in accordance with SFAS No. 128
which re q u i res the presentation of basic and diluted earnings per share. The following schedule pre s e n t s
the calculation of basic and diluted earnings per share for income from continuing operations:
Fiscal Year Ended
J a n u a r y 31, J a n u a r y 25, J a n u a r y 27,
1 9 9 8 1 9 9 7 1 9 9 6
(53 weeks)
B a s i c e a r n i n g s p e r s h a r e :
Income from continuing operations
b e f o re extraord i n a ry item $ 3 0 6 , 5 9 2 $ 2 1 3 , 8 2 6 $ 5 1 , 5 8 9
Less: pre f e rred stock dividends 1 1 , 6 6 8 1 3 , 7 4 1 9 , 4 0 7
Income from continuing operations available
to common share h o l d e r s $ 2 9 4 , 9 2 4 $ 2 0 0 , 0 8 5 $ 4 2 , 1 8 2
Weighted average common stock outstanding
for basic earnings per share 1 6 0 , 7 3 7 , 0 2 3 1 5 0 , 4 6 3 , 4 5 2 1 4 4 , 8 3 0 , 3 5 2
Basic earnings per share $ 1 . 8 3 $ 1 . 3 3 $ . 2 9
D i l u t e d e a r n i n g s p e r s h a r e :
Income from continuing operations
available to common share h o l d e r s $ 2 9 4 , 9 2 4 $ 2 0 0 , 0 8 5 $ 4 2 , 1 8 2
Add back: pre f e rred stock dividends 1 1 , 6 6 8 13,741 9 3
Income from continuing operations for
diluted earnings per share calculation $ 3 0 6 , 5 9 2 $213,826 $ 4 2 , 2 7 5
Weighted average common stock outstanding
for basic earnings per share 160,737,023 150,463,452 1 4 4 , 8 3 0 , 3 5 2
Assumed conversion of:
C o n v e rtible pre f e rred stock 12,016,086 23,165,792 532,314
Stock options 2,052,983 1,695,806 2 8 , 2 8 4
Weighted average common shares for
diluted earnings per share calculation 174,806,092 175,325,050 1 4 5 , 3 9 0 , 9 5 0
Diluted earnings per share $ 1 . 7 5 $ 1 . 2 2 $ . 2 9
G . I n c o m e T a x e s
The provision for income taxes includes the following:
Fiscal Year Ended
J a n u a r y 31, J a n u a r y 25, J a n u a r y 27,
In Thousands 1 9 9 8 1 9 9 7 1 9 9 6
(53 weeks)
C u rre n t :
F e d e r a l $ 1 7 2 , 0 2 6 $ 1 1 6 , 8 4 8 $ 5 2 , 3 0 6
S t a t e 3 9 , 2 0 0 2 7 , 1 6 0 1 2 , 6 0 4
F o re i g n 8 , 1 1 7 8 , 0 7 9 2 , 8 4 3
D e f e rre d :
F e d e r a l ( 3 , 4 3 2 ) 3 3 ( 2 5 , 5 9 3 )
S t a t e ( 3 2 6 ) 4 6 2 ( 5 , 3 6 1 )
F o re i g n 9 4 ( 2 6 8 ) 4 0 8
P rovision for income taxes $ 2 1 5 , 6 7 9 $ 1 5 2 , 3 1 4 $ 3 7 , 2 0 7