TJ Maxx 1997 Annual Report Download - page 11
Download and view the complete annual report
Please find page 11 of the 1997 TJ Maxx annual report below. You can navigate through the pages in the report by either clicking on the pages listed below, or by using the keyword search tool below to find specific information within the annual report.-
 1
1 -
 2
2 -
 3
3 -
 4
4 -
 5
5 -
 6
6 -
 7
7 -
 8
8 -
 9
9 -
 10
10 -
 11
11 -
 12
12 -
 13
13 -
 14
14 -
 15
15 -
 16
16 -
 17
17 -
 18
18 -
 19
19 -
 20
20 -
 21
21 -
 22
22 -
23
-
24
-
25
-
26
-
27
 |
 |

26
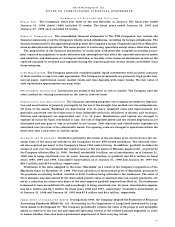
The fair value of the Company’s long-term debt, including current installments, is estimated using dis-
counted cash flow analysis based upon the Company’s current incremental borrowing rates for similar
types of borrowing arrangements. The fair value of long-term debt, including current installments, at
J a n u a ry 31, 1998 is estimated to be $253 million compared to a carrying value of $244.4 million. These esti-
mates do not necessarily reflect certain provisions or restrictions in the various debt agreements which
might affect the Company’s ability to settle these obligations.
D . C o m m i t m e n t s
The Company is committed under long-term leases related to its continuing operations for the rental of re a l
estate, and fixtures and equipment. T.J. Maxx leases are generally for a ten year initial term with options
to extend for one or more five year periods. Marshalls leases, acquired in fiscal 1996, have remaining term s
ranging up to twenty-five years. In addition, the Company is generally re q u i red to pay insurance, re a l
estate taxes and other operating expenses including, in some cases, rentals based on a percentage of sales.
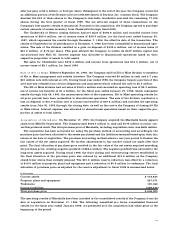
Following is a schedule of future minimum lease payments for continuing operations as of January 31, 1998:
O p e r a t i n g
In Thousands L e a s e s
Fiscal Ye a r
1 9 9 9 $ 302,177
2 0 0 0 2 8 8 , 6 0 3
2 0 0 1 2 6 0 , 7 5 3
2 0 0 2 2 3 3 , 5 1 3
2 0 0 3 2 1 0 , 9 8 3
Later years 1 , 0 0 6 , 0 5 9
Total future minimum lease payments $ 2 , 3 0 2 , 0 8 8
The rental expense under operating leases for continuing operations amounted to $301.9 million, $293.5
million and $162.5 million for fiscal years 1998, 1997 and 1996, re s p e c t i v e l y. The present value of the
C o m p a n y ’s operating lease obligations approximates $1,547.2 million as of January 31, 1998, including
$180.0 million payable in fiscal 1999.
The Company had outstanding letters of credit in the amount of $55.9 million as of January 31, 1998.
Letters of credit are issued by the Company primarily for the purchase of inventory.
E . S t o c k C o m p e n s a t i o n P l a n s
In the following note, all references to historical awards, outstanding awards and availability of shares for
future grants under the Company’s Stock Incentive Plan and related prices per share have been restated,
for comparability purposes, for the two-for-one stock split distributed in June 1997.
The Company has a Stock Incentive Plan under which options and other stock awards may be granted
to certain officers and key employees. The Stock Incentive Plan, as amended, provides for the issuance of
up to 21 million shares with 8.7 million shares available for future grants as of January 31, 1998. The
Company also has a Directors Stock Option Plan under which stock options are granted to directors who
a re not otherwise employed by the Company. This plan provides for the issuance of up to 100,000 share s .
T h e re are 61,000 shares available for future grants under this plan as of January 31, 1998.
Under its stock option plans, the Company has granted options for the purchase of common stock, gen-
erally within ten years from the grant date at option prices of 100% of market price on the grant date. Most
options outstanding are exercisable at various percentages starting one year after the grant, while cert a i n
options are exercisable in their entirety three years after the grant date. Options granted to dire c t o r s
become fully exercisable one year after the date of grant.
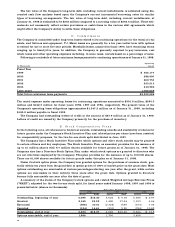
A summary of the status of the Company’s stock options and related Weighted Average Exercise Prices
( “ WAEP”), adjusted for the two-for-one stock split, for fiscal years ended January 1998, 1997 and 1996 is
p resented below (shares in thousands):
Fiscal Year Ended January
1 9 9 8 1 9 9 7 1 9 9 6
S h a re s WA E P S h a re s WA E P S h a re s WA E P
Outstanding, beginning of year 4 , 0 9 6 $ 1 2 . 2 0 5 , 6 2 4 $ 9 . 1 8 5 , 3 8 9 $ 9 . 9 7
G r a n t e d 2 , 1 6 9 2 5 . 9 3 1 , 4 2 6 1 7 . 4 4 1 , 1 9 3 6 . 4 4
E x e rc i s e d ( 8 7 8 ) 1 0 . 6 1 ( 2 , 7 2 4 ) 8 . 8 9 ( 1 6 4 ) 7 . 0 4
C a n c e l e d ( 1 3 4 ) 1 4 . 6 1 ( 2 3 0 ) 9 . 9 0 ( 7 9 4 ) 1 0 . 6 3
Outstanding, end of year 5 , 2 5 3 $ 1 8 . 0 7 4 , 0 9 6 $ 1 2 . 2 0 5 , 6 2 4 $ 9 . 1 8
Options exercisable, end of year 1 , 9 6 6 1 , 7 0 6 3 , 4 9 6