Square Enix 2009 Annual Report Download - page 50
Download and view the complete annual report
Please find page 50 of the 2009 Square Enix annual report below. You can navigate through the pages in the report by either clicking on the pages listed below, or by using the keyword search tool below to find specific information within the annual report.-
 1
1 -
2
-
3
-
4
-
5
-
6
-
7
-
8
-
9
-
10
-
11
-
12
-
13
-
14
-
15
-
16
-
17
-
18
-
19
-
20
-
21
-
22
-
23
-
24
-
25
-
26
-
27
-
28
-
29
-
30
-
31
-
32
-
33
-
34
-
35
-
36
-
37
-
38
-
39
-
 40
40 -
 41
41 -
 42
42 -
 43
43 -
 44
44 -
 45
45 -
 46
46 -
 47
47 -
 48
48 -
 49
49 -
 50
50 -
 51
51 -
 52
52 -
 53
53 -
 54
54 -
 55
55 -
 56
56 -
 57
57 -
 58
58 -
 59
59 -
 60
60
 |
 |

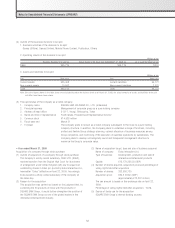
3. There were no unallocated operating expenses included in “Eliminations or unallocated.”
4. There were no unallocated assets included in “Eliminations or unallocated.”
5. Change in accounting policy
As noted in “Summary of Significant Accounting Policies Used in the Preparation of Consolidated Financial Statements,” Section 4. (2) (A), pursuant to the revision
of the Corporation Tax Law, effective the fiscal year ended March 31, 2008, for tangible fixed assets acquired on or after April 1, 2007, the Company and its
domestic consolidated subsidiaries have changed their method of accounting for depreciation to that provided under the revised Corporation Tax Law.
The impact of this change was an ¥828 million increase in operating expenses and a decrease in operating income of the same amount in Japan as compared
to the corresponding amounts which would have been recorded under the previous method.
6. Additional information
As noted in “Summary of Significant Accounting Policies Used in the Preparation of Consolidated Financial Statements,” Section 4. (2) (A), pursuant to the revision
of the Corporation Tax Law, effective the fiscal year ended March 31, 2008, for assets acquired on or before March 31, 2007, the Company and its domestic con-
solidated subsidiaries apply the method of accounting for depreciation provided for in the Corporation Tax Law prior to the revision and depreciate the difference
between 5% of an asset’s acquisition cost and its memorandum value using the straight-line method over a period of five years, from the fiscal year following the
fiscal year in which the net book value of the asset reaches 5% of its acquisition cost. Such depreciation is recorded in depreciation expense.
The impact of this change was a ¥149 million increase in operating expenses and a decrease in operating income of the same amount in Japan as compared to
the corresponding amounts which would have been recorded under the previous method.
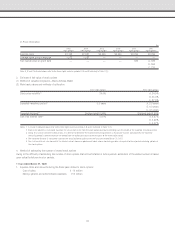
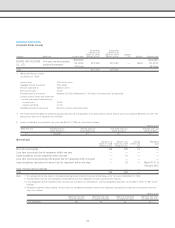
• Year ended March 31, 2009
Millions of yen
North Eliminations or Consolidated
Japan America Europe Asia Total unallocated total
I Sales and operating income
Net sales
(1) Sales to external customers ¥115,681 ¥13,247 ¥ 6,417 ¥ 346 ¥135,693 ¥ — ¥135,693
(2) Intersegment sales 5,908 175 302 21 6,407 (6,407) —
Total 121,590 13,423 6,720 367 142,101 (6,407) 135,693
Operating expenses 112,949 10,694 5,733 444 129,821 (6,405) 123,415
Operating income (loss) 8,640 2,728 987 (77) 12,279 (1) 12,277
II Total assets ¥202,370 ¥15,785 ¥18,108 ¥1,639 ¥237,904 ¥(24,710) ¥213,194
Notes: 1. The classification of geographic segments is made based on geographical distance.
2. Main countries included in each segment:
(1) North America........................... the United States of America
(2) Europe..................................... the United Kingdom
(3) Asia........................................ the People’s Republic of China, Republic of Korea
3. There were no unallocated operating expenses included in “Eliminations or unallocated.”
4. There were no unallocated assets included in “Eliminations or unallocated.”
5. Change in accounting policy
As noted in New Accounting Standard (Inventories), effective from the fiscal year ended March 31, 2009, the Company has applied “Accounting Standard for
Measurement of Inventories” (ASBJ Statement No. 9, issued on July 5, 2006). As a result of this change, operating income decreased by ¥645 million in Japan
and by ¥39 million in Asia compared with the previous method.
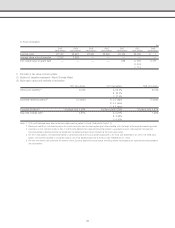
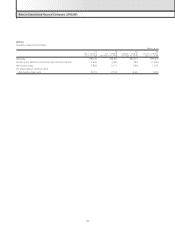
[Consolidated Overseas Sales]
• Year ended March 31, 2008
Millions of yen
North America Europe Asia Total
I Overseas sales ¥13,358 ¥7,896 ¥1,118 ¥ 22,373¥13,358 ¥7,896 ¥1,118 ¥ 22,373
II Consolidated sales — — — 147,516— — — 147,516
III Overseas sales as a percentage of consolidated sales 9.1% 5.4% 0.8% 15.2%9.1% 5.4% 0.8% 15.2%
Notes: 1. The classification of geographic segments is made based on geographical distance.
2. Main countries included in each segment:
(1) North America .......................... the United States of America, Canada
(2) Europe .................................... the United Kingdom, France, Germany, others
(3) Asia ........................................ the People’s Republic of China, Republic of Korea, others
3. Overseas sales represent sales of the Company and its consolidated subsidiaries to countries and areas outside Japan.
Notes to Consolidated Financial Statements (JPNGAAP)
48