Square Enix 2009 Annual Report Download - page 21
Download and view the complete annual report
Please find page 21 of the 2009 Square Enix annual report below. You can navigate through the pages in the report by either clicking on the pages listed below, or by using the keyword search tool below to find specific information within the annual report.-
 1
1 -
2
-
3
-
4
-
5
-
6
-
7
-
8
-
9
-
10
-
 11
11 -
 12
12 -
 13
13 -
 14
14 -
 15
15 -
 16
16 -
 17
17 -
 18
18 -
 19
19 -
 20
20 -
 21
21 -
 22
22 -
 23
23 -
 24
24 -
 25
25 -
 26
26 -
 27
27 -
 28
28 -
 29
29 -
 30
30 -
 31
31 -
32
-
33
-
34
-
35
-
36
-
37
-
38
-
39
-
40
-
41
-
42
-
43
-
44
-
45
-
46
-
47
-
48
-
49
-
50
-
51
-
52
-
53
-
54
-
55
-
56
-
57
-
58
-
59
-
60
 |
 |

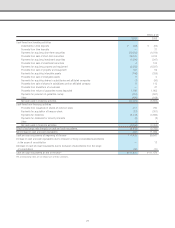
Consolidated Statements of Income
Net Sales and Operating Income
Millions of yen
Years ended March 31 2008 Composition 2009 Composition Amount change Percent change
Net sales ¥147,516 100.0% ¥135,693 100.0% ¥(11,823) (8.0)%
Gross profit 66,314 45.0 56,166 41.4 (10,148) (15.3)
Reversal of allowance for sales returns 2,271 1.5 1,135 0.8 (1,136) (50.0)
Provision for allowance for sales returns 1,135 0.8 1,598 1.2 463 40.7
Net gross profit 67,450 45.7 55,703 41.1 (11,747) (17.4)
Selling, general and administrative
expenses 45,929 31.1 43,426 32.0 (2,503) (5.4)
Operating income 21,520 14.6 12,277 9.0 (9,243) (43.0)
Comparisons by segment with the preceding fiscal year are provided in the section describing operating performance on pages 8–11.
Non-Operating Income and Expenses
Millions of yen
Years ended March 31 2008 2009 Change
Non-operating income ¥1,367 ¥ 909 ¥ (458)
Non-operating expenses 4,023 1,925 (2,098)
Non-operating income decreased by ¥458 million to ¥909 million,
mainly owing to a decrease in interest income.
Non-operating expenses amounted to ¥1,925 million, primarily
owing to a foreign exchange loss of ¥1,715 million.
Extraordinary Gain and Loss
Millions of yen
Years ended March 31 2008 2009 Change
Extraordinary gain ¥1,439 ¥ 228 ¥(1,211)
Extraordinary loss 3,618 2,350 (1,268)
Extraordinary gain decreased by ¥1,211 million to ¥228 million. In
the previous fiscal year, reversal of allowance for closing of game
arcades generated a gain of ¥1,098 million.
Extraordinary loss totaled ¥2,350 million. Significant items
within this included loss on disposal of property and equipment, and
impairment loss. In the previous fiscal year, the Company recorded
a loss on disposal and write-downs of assets associated with
business restructuring of ¥1,302 million, and loss on disposal
of property and equipment of ¥950 million.
Capital Expenditures and Depreciation
Millions of yen
Years ended March 31 2008 2009 Change
Capital expenditures ¥6,952 ¥13,131 ¥ 6,179
Depreciation and amortization 9,933 6,978 (2,955)
Capital expenditures for the fiscal year ended March 31, 2009
amounted to ¥13,131 million, an increase of ¥6,179 million
compared with the previous fiscal year. This was mainly owing to
the acquisition of land and purchase of amusement equipment.
Depreciation and amortization decreased by ¥2,955 million
to ¥6,978 million due to use of leased assets in part, in time of
amusement equipment acquisition from the previous fiscal year.
Overseas Sales
North America
Millions of yen
Years ended March 31 2008 2009 Change
¥13,358 ¥14,285 ¥927
The Group primarily is engaged in the Games (Offline) and Games
(Online) businesses in North America. In the Games (Offline) business
in this region, sales of game content developed by the Company are
handled primarily by SQUARE ENIX, INC., a wholly-owned subsidiary
of the Company. In the Games (Online) business in this region, the
Group provides online game services and sells software discs for
online games.
In the fiscal year ended March 31, 2009, sales in North America
totaled ¥14,285 million, an increase of ¥927 million.
Europe
Millions of yen
Years ended March 31 2008 2009 Change
¥7,896 ¥6,713 ¥(1,183)
The Group primarily is engaged in the Games (Offline) and Games
(Online) businesses in Europe. In the Games (Offline) business in
this region, sales of game content developed by the Company are
handled primarily by SQUARE ENIX LTD., a wholly-owned subsidiary
of the Company. In the Games (Online) business in this region, the
Group provides online game services and sells software discs for
online games.
In the fiscal year ended March 31, 2009, sales in Europe
amounted to ¥6,713 million, a decrease of ¥1,183 million.
19